
XAUUSD — 4,092 Broke the Door
Gold started the new week with that heavy feeling again, like Friday’s recovery never really convinced the market.
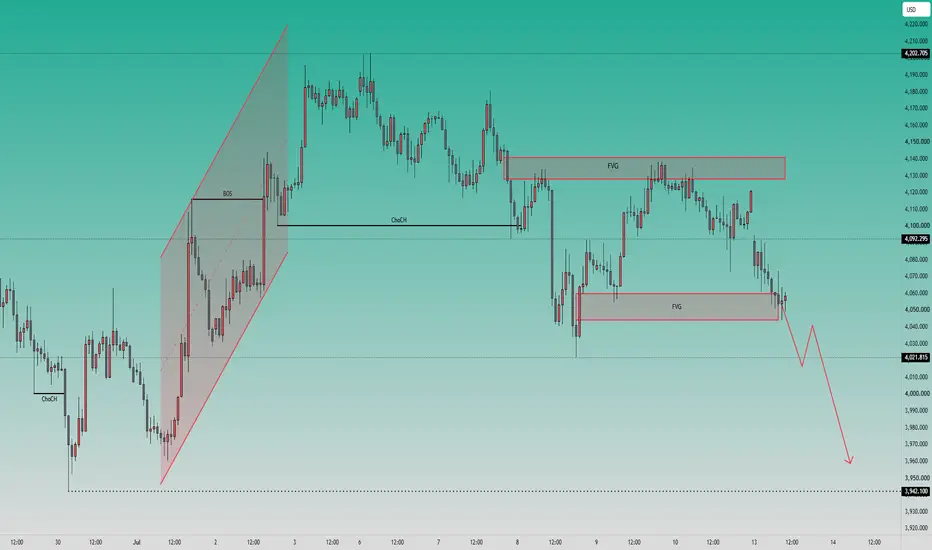
Price tried to breathe above the lower FVG, but once it failed to hold around 4,092.295, the chart started telling a different story. That level was not just a random line. It was the area buyers needed to protect if the short-term recovery wanted to stay alive. Instead, gold slipped back below it, and now price is pressing into the lower imbalance zone around 4,040 - 4,060.
For newer traders, this is where the structure becomes important. When price returns into an FVG but cannot bounce strongly, that zone can stop looking like demand and start acting like a weak floor. The market taps it, pauses for a moment, then if buyers do not show real strength, sellers often use that pause to continue hunting lower liquidity.
That is why my main view is bearish while gold stays below 4,092.295. The wider backdrop also supports pressure, with price still trading under the short-term moving average and momentum readings not showing strong buyer control yet. Add the stronger USD reaction and renewed geopolitical tension, and the chart has a reason to keep selling rallies instead of trusting every bounce.
The next area I am watching is 4,021.815. If gold reaches that level and only gives a weak reaction, the bigger downside magnet becomes 3,942.100, where deeper sell-side liquidity is still waiting.
This bearish idea only becomes weaker if gold can reclaim 4,092.295 and then push back above the upper FVG around 4,130 - 4,140. Until then, I see the market as hunting lower, not recovering cleanly.
Key price zones to watch
Current reaction area: 4,040 - 4,060
Main supply / failed recovery zone: 4,092.295
Bearish confirmation zone: clean hold below 4,092.295
First downside liquidity target: 4,021.815
Main downside liquidity target: 3,942.100
Upper FVG resistance: 4,130 - 4,140
Major upside liquidity: 4,202.705
Invalidation: clean reclaim above 4,140
Do you think gold breaks straight toward 4,021, or does it fake one more bounce into the FVG before sellers return?
Gold started the new week with that heavy feeling again, like Friday’s recovery never really convinced the market.
Price tried to breathe above the lower FVG, but once it failed to hold around 4,092.295, the chart started telling a different story. That level was not just a random line. It was the area buyers needed to protect if the short-term recovery wanted to stay alive. Instead, gold slipped back below it, and now price is pressing into the lower imbalance zone around 4,040 - 4,060.
For newer traders, this is where the structure becomes important. When price returns into an FVG but cannot bounce strongly, that zone can stop looking like demand and start acting like a weak floor. The market taps it, pauses for a moment, then if buyers do not show real strength, sellers often use that pause to continue hunting lower liquidity.
That is why my main view is bearish while gold stays below 4,092.295. The wider backdrop also supports pressure, with price still trading under the short-term moving average and momentum readings not showing strong buyer control yet. Add the stronger USD reaction and renewed geopolitical tension, and the chart has a reason to keep selling rallies instead of trusting every bounce.
The next area I am watching is 4,021.815. If gold reaches that level and only gives a weak reaction, the bigger downside magnet becomes 3,942.100, where deeper sell-side liquidity is still waiting.
This bearish idea only becomes weaker if gold can reclaim 4,092.295 and then push back above the upper FVG around 4,130 - 4,140. Until then, I see the market as hunting lower, not recovering cleanly.
Key price zones to watch
Current reaction area: 4,040 - 4,060
Main supply / failed recovery zone: 4,092.295
Bearish confirmation zone: clean hold below 4,092.295
First downside liquidity target: 4,021.815
Main downside liquidity target: 3,942.100
Upper FVG resistance: 4,130 - 4,140
Major upside liquidity: 4,202.705
Invalidation: clean reclaim above 4,140
Do you think gold breaks straight toward 4,021, or does it fake one more bounce into the FVG before sellers return?
Trade ist aktiv

👉 5–7 Free One-Shot Signals Weekly
👉 Daily Market Plan & Bias
🔥 VIP: 4–6 Swings + 10–20 Scalps Daily
📈 Transparent results, clear setups
👉Click here: t.me/+FgX34kKeY0cyZjc1
👉 Daily Market Plan & Bias
🔥 VIP: 4–6 Swings + 10–20 Scalps Daily
📈 Transparent results, clear setups
👉Click here: t.me/+FgX34kKeY0cyZjc1
Verbundene Veröffentlichungen
Haftungsausschluss
Die Informationen und Veröffentlichungen sind nicht als Finanz-, Anlage-, Handels- oder andere Arten von Ratschlägen oder Empfehlungen gedacht, die von TradingView bereitgestellt oder gebilligt werden, und stellen diese nicht dar. Lesen Sie mehr in den Nutzungsbedingungen.
👉 5–7 Free One-Shot Signals Weekly
👉 Daily Market Plan & Bias
🔥 VIP: 4–6 Swings + 10–20 Scalps Daily
📈 Transparent results, clear setups
👉Click here: t.me/+FgX34kKeY0cyZjc1
👉 Daily Market Plan & Bias
🔥 VIP: 4–6 Swings + 10–20 Scalps Daily
📈 Transparent results, clear setups
👉Click here: t.me/+FgX34kKeY0cyZjc1
Verbundene Veröffentlichungen
Haftungsausschluss
Die Informationen und Veröffentlichungen sind nicht als Finanz-, Anlage-, Handels- oder andere Arten von Ratschlägen oder Empfehlungen gedacht, die von TradingView bereitgestellt oder gebilligt werden, und stellen diese nicht dar. Lesen Sie mehr in den Nutzungsbedingungen.