
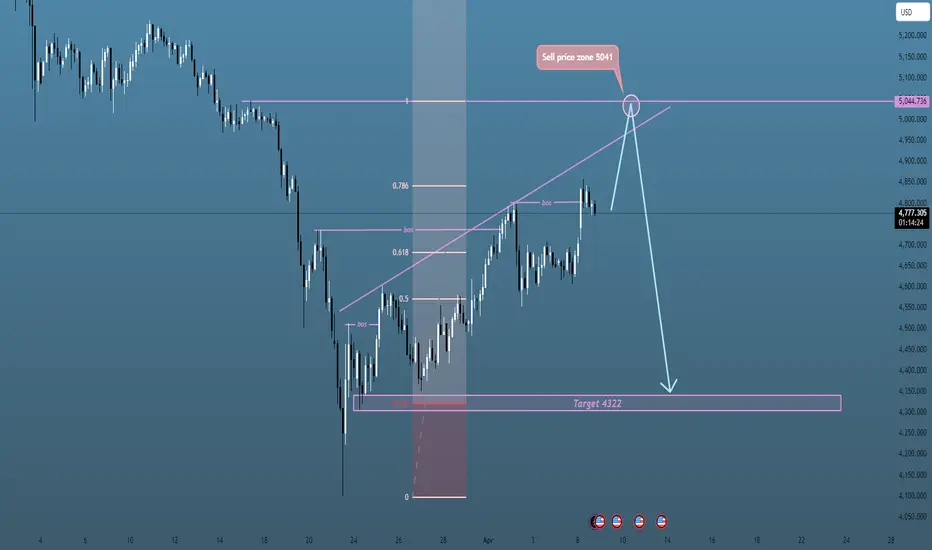
XAUUSD Rejected at 5040 — Distribution or Just a Pullback?
Gold is starting to show clear signs of exhaustion near the 5000–5040 zone, and the latest fundamental data is beginning to align with the technical picture.
Fundamental pressure building
According to the latest report, global gold ETFs recorded a massive $12B outflow in March, cutting Q1 inflows in half and breaking a 9-month streak of strong accumulation.
This shift suggests:
institutional demand is cooling off
smart money may be taking profit at higher levels
bullish momentum is no longer as strong as before
This is important — because gold rallies without sustained inflow tend to become fragile.
Technical structure — clear rejection at supply
From the chart:
price rallied strongly into 5040–5050 resistance
this zone aligns with previous structure + Fibonacci expansion
immediate rejection confirms sell-side interest is active
At the same time:
trendline support is still holding for now
but momentum is slowing, forming a potential distribution phase
Key levels to watch
5040–5050 → major sell zone / rejection area
4780–4800 → short-term structure pivot
4322 → main downside target (liquidity zone)
Primary scenario — bearish continuation
If price fails to reclaim the 5040 zone and continues to respect resistance:
market may roll over from current levels
break below 4780 structure would confirm weakness
downside expansion could extend toward 4322 liquidity target
This aligns with the idea of:
distribution → breakdown → continuation lower
Alternative scenario — bullish trap
If price manages to:
reclaim 5000 with strong momentum
and hold above resistance
Then the current rejection could turn into a liquidity sweep before continuation higher
However, given the ETF outflows, this scenario currently has lower probability.
Cecilia’s view
This is no longer a clean uptrend.
We are likely transitioning into a decision phase, where:
fundamentals are weakening
technicals are showing rejection
liquidity is sitting below
That combination often leads to deeper corrective moves before any continuation.
Final thought
Gold is not collapsing yet —
but the market is clearly losing bullish conviction at highs.
And when smart money starts exiting while price is rejecting resistance,
it’s usually a signal to stay cautious with longs.
Current bias: short below 5040, targeting lower liquidity zones.
Gold is starting to show clear signs of exhaustion near the 5000–5040 zone, and the latest fundamental data is beginning to align with the technical picture.
Fundamental pressure building
According to the latest report, global gold ETFs recorded a massive $12B outflow in March, cutting Q1 inflows in half and breaking a 9-month streak of strong accumulation.
This shift suggests:
institutional demand is cooling off
smart money may be taking profit at higher levels
bullish momentum is no longer as strong as before
This is important — because gold rallies without sustained inflow tend to become fragile.
Technical structure — clear rejection at supply
From the chart:
price rallied strongly into 5040–5050 resistance
this zone aligns with previous structure + Fibonacci expansion
immediate rejection confirms sell-side interest is active
At the same time:
trendline support is still holding for now
but momentum is slowing, forming a potential distribution phase
Key levels to watch
5040–5050 → major sell zone / rejection area
4780–4800 → short-term structure pivot
4322 → main downside target (liquidity zone)
Primary scenario — bearish continuation
If price fails to reclaim the 5040 zone and continues to respect resistance:
market may roll over from current levels
break below 4780 structure would confirm weakness
downside expansion could extend toward 4322 liquidity target
This aligns with the idea of:
distribution → breakdown → continuation lower
Alternative scenario — bullish trap
If price manages to:
reclaim 5000 with strong momentum
and hold above resistance
Then the current rejection could turn into a liquidity sweep before continuation higher
However, given the ETF outflows, this scenario currently has lower probability.
Cecilia’s view
This is no longer a clean uptrend.
We are likely transitioning into a decision phase, where:
fundamentals are weakening
technicals are showing rejection
liquidity is sitting below
That combination often leads to deeper corrective moves before any continuation.
Final thought
Gold is not collapsing yet —
but the market is clearly losing bullish conviction at highs.
And when smart money starts exiting while price is rejecting resistance,
it’s usually a signal to stay cautious with longs.
Current bias: short below 5040, targeting lower liquidity zones.

Verbundene Veröffentlichungen
Haftungsausschluss
Die Informationen und Veröffentlichungen sind nicht als Finanz-, Anlage-, Handels- oder andere Arten von Ratschlägen oder Empfehlungen gedacht, die von TradingView bereitgestellt oder gebilligt werden, und stellen diese nicht dar. Lesen Sie mehr in den Nutzungsbedingungen.
Verbundene Veröffentlichungen
Haftungsausschluss
Die Informationen und Veröffentlichungen sind nicht als Finanz-, Anlage-, Handels- oder andere Arten von Ratschlägen oder Empfehlungen gedacht, die von TradingView bereitgestellt oder gebilligt werden, und stellen diese nicht dar. Lesen Sie mehr in den Nutzungsbedingungen.