
My recommendations:
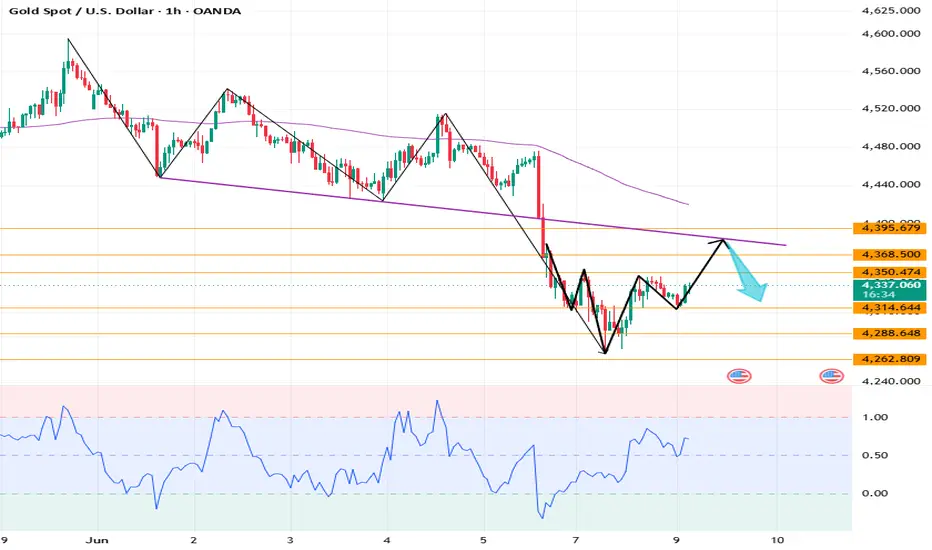
First resistance level: 4350; second resistance level: 4368; third resistance level: 4395
First support level: 4315; second support level: 4288; third support level: 4263
The primary strategy for gold trading remains selling on rallies. On the daily chart, the 10-day and 7-day moving averages (MA) maintain a downward crossover; resistance from moving averages has shifted down to 4428/4400, and resistance from the 5-day MA has moved down to 4368. The RSI indicator remains below the 50 midline, and the price is trading between the middle and lower bands of the Bollinger Bands. On the shorter-term 4-hour and 1-hour charts, the Bollinger Bands are widening downwards, moving averages show a downward crossover, and the RSI is operating below the midline.
After testing lows and rebounding yesterday, gold closed the daily chart with a "Doji" candle featuring a long lower shadow; this long shadow indicates strong buying interest at lower levels. On the hourly chart, the market appears to be forming a potential "head and shoulders bottom" pattern: the shoulders are near 4310, the head is at 4268, and the 4350 level acts as the neckline. A breakout above the 4350 resistance could lead to a rebound towards the 4400 area.
My recommendations:
BUY: 4280-4290, SL: 4260, TP: 4350-4380;
SELL: 4370-4380, SL: 4400, TP: 4320-4300;
First resistance level: 4350; second resistance level: 4368; third resistance level: 4395
First support level: 4315; second support level: 4288; third support level: 4263
The primary strategy for gold trading remains selling on rallies. On the daily chart, the 10-day and 7-day moving averages (MA) maintain a downward crossover; resistance from moving averages has shifted down to 4428/4400, and resistance from the 5-day MA has moved down to 4368. The RSI indicator remains below the 50 midline, and the price is trading between the middle and lower bands of the Bollinger Bands. On the shorter-term 4-hour and 1-hour charts, the Bollinger Bands are widening downwards, moving averages show a downward crossover, and the RSI is operating below the midline.
After testing lows and rebounding yesterday, gold closed the daily chart with a "Doji" candle featuring a long lower shadow; this long shadow indicates strong buying interest at lower levels. On the hourly chart, the market appears to be forming a potential "head and shoulders bottom" pattern: the shoulders are near 4310, the head is at 4268, and the 4350 level acts as the neckline. A breakout above the 4350 resistance could lead to a rebound towards the 4400 area.
My recommendations:
BUY: 4280-4290, SL: 4260, TP: 4350-4380;
SELL: 4370-4380, SL: 4400, TP: 4320-4300;

💥 Full-time finance professional.
💥More than 11 years of experience in gold trading
⬇️I will guide you to profitability.
My Telegram : t.me/JungoldAnalyst
💥More than 11 years of experience in gold trading
⬇️I will guide you to profitability.
My Telegram : t.me/JungoldAnalyst
Haftungsausschluss
Die Informationen und Veröffentlichungen sind nicht als Finanz-, Anlage-, Handels- oder andere Arten von Ratschlägen oder Empfehlungen gedacht, die von TradingView bereitgestellt oder gebilligt werden, und stellen diese nicht dar. Lesen Sie mehr in den Nutzungsbedingungen.
💥 Full-time finance professional.
💥More than 11 years of experience in gold trading
⬇️I will guide you to profitability.
My Telegram : t.me/JungoldAnalyst
💥More than 11 years of experience in gold trading
⬇️I will guide you to profitability.
My Telegram : t.me/JungoldAnalyst
Haftungsausschluss
Die Informationen und Veröffentlichungen sind nicht als Finanz-, Anlage-, Handels- oder andere Arten von Ratschlägen oder Empfehlungen gedacht, die von TradingView bereitgestellt oder gebilligt werden, und stellen diese nicht dar. Lesen Sie mehr in den Nutzungsbedingungen.