
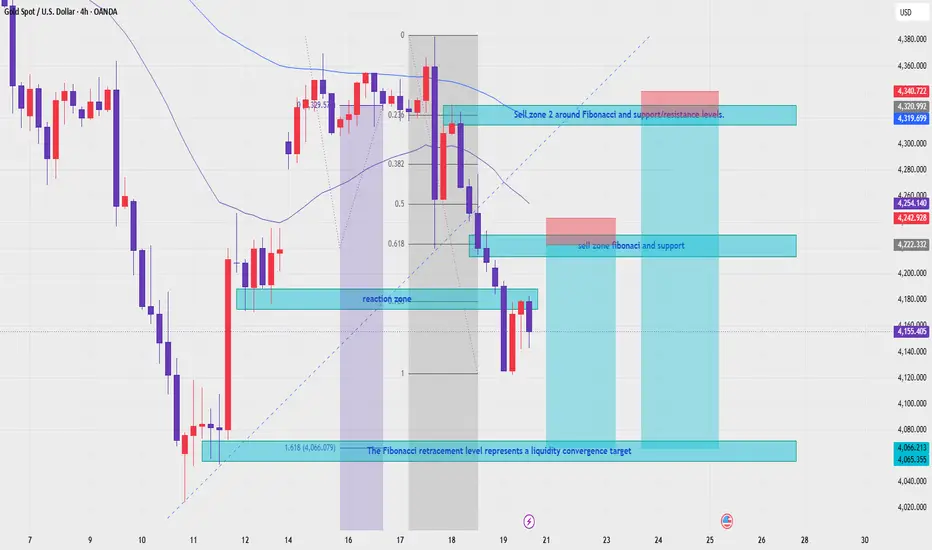
XAUUSD — EMA Bearish Trend, Two Sell Zones Toward Fibonacci Liquidity Target
Fundamental Analysis
Gold remains under bearish pressure as price continues to trade below the main EMA structure. The market is still watching USD strength, Treasury yields, and upcoming U.S. data, which may create volatility around key Fibonacci and liquidity zones.
For next week, the main view remains bearish while recovery attempts stay below the EMA resistance area.
Technical Analysis
On the 4H chart, XAUUSD is still trading below EMA 34, EMA 89, and EMA 200. This confirms that the broader short-term trend remains bearish, with the EMA structure acting as dynamic resistance above price.
Price is currently around 4,155 after a strong bearish move from the upper structure. The chart shows that gold is now reacting near a short-term reaction zone, but the recovery has not yet confirmed a bullish reversal.
The first sell area is around 4,222 - 4,243. This zone aligns with Fibonacci retracement, previous support turned resistance, and short-term liquidity. If price pulls back into this area and rejects, sellers may continue to defend the trend.
The second sell area is higher, around 4,320 - 4,341. This zone is stronger because it aligns with Fibonacci resistance, EMA pressure, and a larger support/resistance liquidity area. If gold retraces deeper into this zone, it may offer another sell opportunity with a wider structure.
The main downside target remains the Fibonacci 1.618 liquidity convergence zone around 4,066 - 4,065.
Important Key Levels
Current price area: 4,155
Reaction zone: 4,170 - 4,180
Sell zone 1: 4,222 - 4,243
Sell zone 2: 4,320 - 4,341
EMA resistance area: 4,254 - 4,320
Liquidity convergence target: 4,066 - 4,065
Invalidation for sell zone 1: above 4,254
Invalidation for sell zone 2: above 4,341
Trading Scenario
Sell Scenario 1 — Fibonacci Support Retest
Entry: 4,222 - 4,243
Stop Loss: 4,254
Take Profit 1: 4,170
Take Profit 2: 4,120
Take Profit 3: 4,066 - 4,065
Sell Condition
The first sell setup is to wait for gold to pull back into 4,222 - 4,243. This area is the nearest Fibonacci and support/resistance retest zone.
A sell setup becomes more valid if price forms bearish rejection from this zone, such as a long upper wick, bearish engulfing candle, failed breakout, or lower high below the EMA structure.
Sell Scenario 2 — Higher Liquidity Sell Zone
Entry: 4,320 - 4,341
Stop Loss: 4,365
Take Profit 1: 4,243
Take Profit 2: 4,170
Take Profit 3: 4,066 - 4,065
Sell Condition
The second sell setup is only considered if gold retraces deeper into 4,320 - 4,341. This is the stronger liquidity and Fibonacci resistance zone on the chart.
A rejection from this area would show that buyers failed to reclaim the EMA resistance zone. If sellers defend this level, the next bearish leg may target 4,243 first, then 4,170 and the Fibonacci 1.618 target around 4,066 - 4,065.
Entry Conditions
Wait for price to retest one of the sell zones.
Look for bearish rejection before entering sell.
Do not sell directly at the low without a pullback.
A break below 4,120 would strengthen the move toward 4,066.
If price breaks and holds above 4,341 - 4,365, the bearish setup should be reassessed.
Overall, the main view remains bearish while XAUUSD trades below EMA 34, EMA 89, and EMA 200. For next week, the preferred plan is to wait for a pullback into 4,222 - 4,243 or 4,320 - 4,341, then look for sell confirmation toward the Fibonacci liquidity convergence target around 4,066 - 4,065.
Do you share the same bearish view on gold for next week, or are you waiting for a cleaner pullback into the higher sell zone first?
Fundamental Analysis
Gold remains under bearish pressure as price continues to trade below the main EMA structure. The market is still watching USD strength, Treasury yields, and upcoming U.S. data, which may create volatility around key Fibonacci and liquidity zones.
For next week, the main view remains bearish while recovery attempts stay below the EMA resistance area.
Technical Analysis
On the 4H chart, XAUUSD is still trading below EMA 34, EMA 89, and EMA 200. This confirms that the broader short-term trend remains bearish, with the EMA structure acting as dynamic resistance above price.
Price is currently around 4,155 after a strong bearish move from the upper structure. The chart shows that gold is now reacting near a short-term reaction zone, but the recovery has not yet confirmed a bullish reversal.
The first sell area is around 4,222 - 4,243. This zone aligns with Fibonacci retracement, previous support turned resistance, and short-term liquidity. If price pulls back into this area and rejects, sellers may continue to defend the trend.
The second sell area is higher, around 4,320 - 4,341. This zone is stronger because it aligns with Fibonacci resistance, EMA pressure, and a larger support/resistance liquidity area. If gold retraces deeper into this zone, it may offer another sell opportunity with a wider structure.
The main downside target remains the Fibonacci 1.618 liquidity convergence zone around 4,066 - 4,065.
Important Key Levels
Current price area: 4,155
Reaction zone: 4,170 - 4,180
Sell zone 1: 4,222 - 4,243
Sell zone 2: 4,320 - 4,341
EMA resistance area: 4,254 - 4,320
Liquidity convergence target: 4,066 - 4,065
Invalidation for sell zone 1: above 4,254
Invalidation for sell zone 2: above 4,341
Trading Scenario
Sell Scenario 1 — Fibonacci Support Retest
Entry: 4,222 - 4,243
Stop Loss: 4,254
Take Profit 1: 4,170
Take Profit 2: 4,120
Take Profit 3: 4,066 - 4,065
Sell Condition
The first sell setup is to wait for gold to pull back into 4,222 - 4,243. This area is the nearest Fibonacci and support/resistance retest zone.
A sell setup becomes more valid if price forms bearish rejection from this zone, such as a long upper wick, bearish engulfing candle, failed breakout, or lower high below the EMA structure.
Sell Scenario 2 — Higher Liquidity Sell Zone
Entry: 4,320 - 4,341
Stop Loss: 4,365
Take Profit 1: 4,243
Take Profit 2: 4,170
Take Profit 3: 4,066 - 4,065
Sell Condition
The second sell setup is only considered if gold retraces deeper into 4,320 - 4,341. This is the stronger liquidity and Fibonacci resistance zone on the chart.
A rejection from this area would show that buyers failed to reclaim the EMA resistance zone. If sellers defend this level, the next bearish leg may target 4,243 first, then 4,170 and the Fibonacci 1.618 target around 4,066 - 4,065.
Entry Conditions
Wait for price to retest one of the sell zones.
Look for bearish rejection before entering sell.
Do not sell directly at the low without a pullback.
A break below 4,120 would strengthen the move toward 4,066.
If price breaks and holds above 4,341 - 4,365, the bearish setup should be reassessed.
Overall, the main view remains bearish while XAUUSD trades below EMA 34, EMA 89, and EMA 200. For next week, the preferred plan is to wait for a pullback into 4,222 - 4,243 or 4,320 - 4,341, then look for sell confirmation toward the Fibonacci liquidity convergence target around 4,066 - 4,065.
Do you share the same bearish view on gold for next week, or are you waiting for a cleaner pullback into the higher sell zone first?
Trade ist aktiv
The first day of the new week is great, as the weekend scenario has been a real success.
📊 XAU Macro Pulse · XAUUSD · GBPUSD · EURUSD
Every setup earns its place on the chart.
🔔 Follow the structure. The rest is noise.
Personal analysis only t.me/+TxpetmVvKGhjZDhl
Every setup earns its place on the chart.
🔔 Follow the structure. The rest is noise.
Personal analysis only t.me/+TxpetmVvKGhjZDhl
Verbundene Veröffentlichungen
Haftungsausschluss
Die Informationen und Veröffentlichungen sind nicht als Finanz-, Anlage-, Handels- oder andere Arten von Ratschlägen oder Empfehlungen gedacht, die von TradingView bereitgestellt oder gebilligt werden, und stellen diese nicht dar. Lesen Sie mehr in den Nutzungsbedingungen.
📊 XAU Macro Pulse · XAUUSD · GBPUSD · EURUSD
Every setup earns its place on the chart.
🔔 Follow the structure. The rest is noise.
Personal analysis only t.me/+TxpetmVvKGhjZDhl
Every setup earns its place on the chart.
🔔 Follow the structure. The rest is noise.
Personal analysis only t.me/+TxpetmVvKGhjZDhl
Verbundene Veröffentlichungen
Haftungsausschluss
Die Informationen und Veröffentlichungen sind nicht als Finanz-, Anlage-, Handels- oder andere Arten von Ratschlägen oder Empfehlungen gedacht, die von TradingView bereitgestellt oder gebilligt werden, und stellen diese nicht dar. Lesen Sie mehr in den Nutzungsbedingungen.