
XAUUSD (Gold) – 30 Minute Chart | Detailed Technical Description
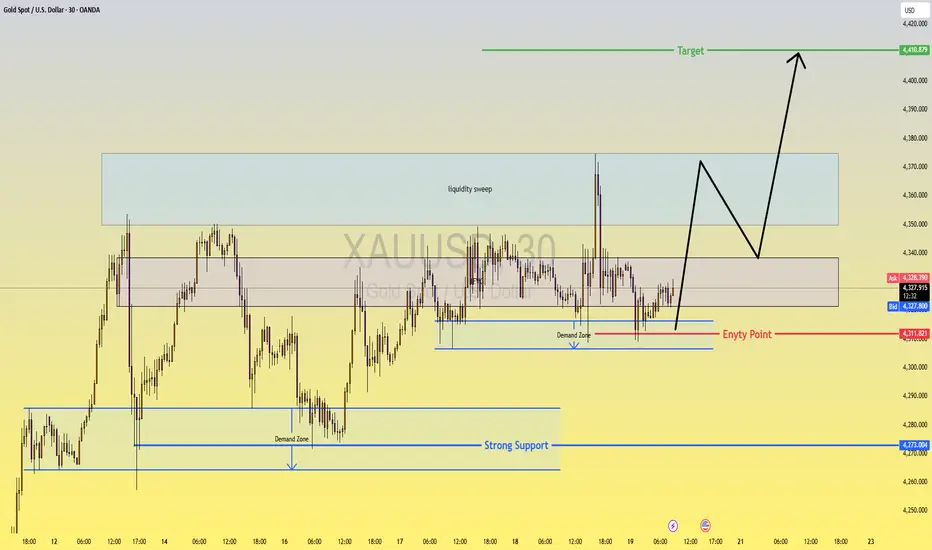
This analysis is based on the 30-minute timeframe of XAUUSD, focusing on market structure, liquidity behavior, demand zones, and projected price path.
Market Context
Gold is currently trading in a range-bound structure after a strong impulsive move earlier. Price has already completed a liquidity sweep on the upside, indicating that buy-side liquidity above previous highs has been taken. After this sweep, price failed to sustain above the premium area and moved back into consolidation.
Key Zones Identified
1. Liquidity Sweep Zone (Upper Supply Area)
The highlighted upper rectangle marks an area where equal highs / resting liquidity existed.
Price aggressively moved into this zone, swept liquidity, and rejected.
This behavior suggests smart money distribution rather than continuation.
This zone acts as a short-term supply / mitigation area.
2. Mid-Range Consolidation Zone
The grey horizontal box represents a balanced price area where the market is consolidating.
Multiple rejections from both top and bottom confirm indecision and accumulation.
This is a key area for internal range trading until a clear breakout occurs.
3. Demand Zone (Entry Area)
The lower highlighted blue zone marks a strong demand zone formed after:
A sharp bullish impulse
Multiple reactions from the same price level
This zone aligns with:
Previous structure support
Unfilled institutional orders
The entry point (around 4311) is marked where bullish reaction is expected.
4. Strong Support
The lower blue horizontal line is a major higher-timeframe support.
This level has previously caused:
Strong bullish reversals
Long impulsive moves upward
If the immediate demand fails, this level becomes the last bullish defense.
Projected Price Path (Black Arrow Structure)
Initial Reaction
Price is expected to react bullishly from the demand zone / entry point.
First move targets the mid-range highs.
Pullback Phase
A corrective pullback is expected after the first impulse.
This pullback is likely to remain above the demand zone, showing strength.
Continuation Move
After holding structure, price is projected to break higher.
Final target is the upper liquidity / target zone around 4410.
Bias Summary
Overall Bias: Bullish (after demand reaction)
Entry Logic: Demand zone + structure support
Invalidation: Clear break and close below demand
Target: Upper liquidity zone (premium area)
Conclusion
This setup reflects a classic liquidity-based structure:
Liquidity taken above
Price returns to demand
Accumulation before expansion
Patience is required for confirmation at the demand zone, as this area will determine whether price continues toward the upper target or revisits deeper support.
Market Context
Gold is currently trading in a range-bound structure after a strong impulsive move earlier. Price has already completed a liquidity sweep on the upside, indicating that buy-side liquidity above previous highs has been taken. After this sweep, price failed to sustain above the premium area and moved back into consolidation.
Key Zones Identified
1. Liquidity Sweep Zone (Upper Supply Area)
The highlighted upper rectangle marks an area where equal highs / resting liquidity existed.
Price aggressively moved into this zone, swept liquidity, and rejected.
This behavior suggests smart money distribution rather than continuation.
This zone acts as a short-term supply / mitigation area.
2. Mid-Range Consolidation Zone
The grey horizontal box represents a balanced price area where the market is consolidating.
Multiple rejections from both top and bottom confirm indecision and accumulation.
This is a key area for internal range trading until a clear breakout occurs.
3. Demand Zone (Entry Area)
The lower highlighted blue zone marks a strong demand zone formed after:
A sharp bullish impulse
Multiple reactions from the same price level
This zone aligns with:
Previous structure support
Unfilled institutional orders
The entry point (around 4311) is marked where bullish reaction is expected.
4. Strong Support
The lower blue horizontal line is a major higher-timeframe support.
This level has previously caused:
Strong bullish reversals
Long impulsive moves upward
If the immediate demand fails, this level becomes the last bullish defense.
Projected Price Path (Black Arrow Structure)
Initial Reaction
Price is expected to react bullishly from the demand zone / entry point.
First move targets the mid-range highs.
Pullback Phase
A corrective pullback is expected after the first impulse.
This pullback is likely to remain above the demand zone, showing strength.
Continuation Move
After holding structure, price is projected to break higher.
Final target is the upper liquidity / target zone around 4410.
Bias Summary
Overall Bias: Bullish (after demand reaction)
Entry Logic: Demand zone + structure support
Invalidation: Clear break and close below demand
Target: Upper liquidity zone (premium area)
Conclusion
This setup reflects a classic liquidity-based structure:
Liquidity taken above
Price returns to demand
Accumulation before expansion
Patience is required for confirmation at the demand zone, as this area will determine whether price continues toward the upper target or revisits deeper support.
Trade ist aktiv
Target Hit
Haftungsausschluss
Die Informationen und Veröffentlichungen sind nicht als Finanz-, Anlage-, Handels- oder andere Arten von Ratschlägen oder Empfehlungen gedacht, die von TradingView bereitgestellt oder gebilligt werden, und stellen diese nicht dar. Lesen Sie mehr in den Nutzungsbedingungen.
Haftungsausschluss
Die Informationen und Veröffentlichungen sind nicht als Finanz-, Anlage-, Handels- oder andere Arten von Ratschlägen oder Empfehlungen gedacht, die von TradingView bereitgestellt oder gebilligt werden, und stellen diese nicht dar. Lesen Sie mehr in den Nutzungsbedingungen.