
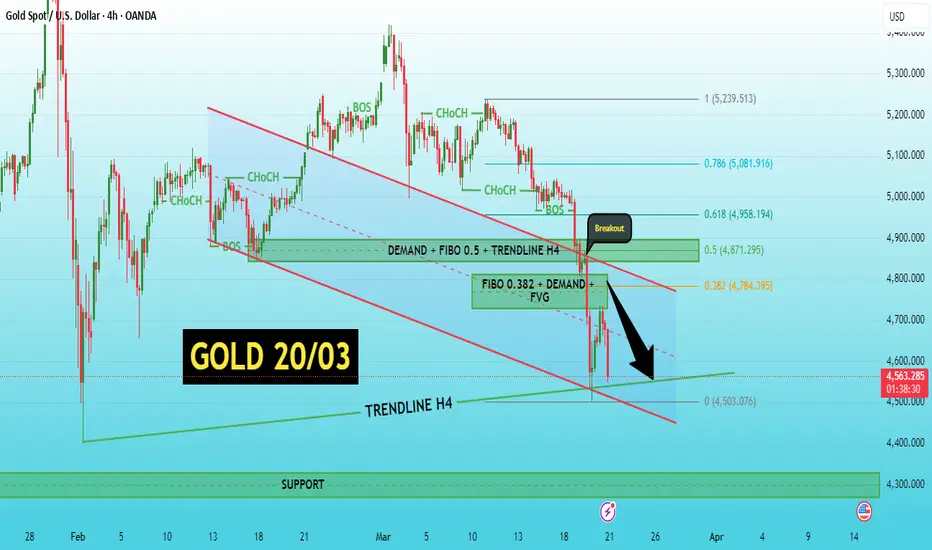
After a technical rebound to the FVG + Fibo 0.382 + Demand zone (~4780–4800), the price reacted as expected: retested and continued to be rejected. This is a textbook rebound in a downtrend — no signs of accumulation, merely creating liquidity to continue selling.
On the macro level, nothing has changed: USD remains strong after FOMC, while gold does not receive safe-haven flows despite geopolitical factors. Most importantly, it's about price action — all good news fails to lift gold back to higher levels, confirming the market is in a true markdown phase.
On the H4 chart, the downtrend structure continues to hold:
Price continuously creates BOS down
Rebounds only stop at the FVG + fibo zone
No signs of reclaiming structure
The 4780–4800 zone is now confirmed as new supply, after the old demand was broken. Right after hitting this zone, the price continues to dump strongly, showing that sellers are still in full control.
Currently, the price is moving down near the lower H4 trendline zone (~4550–4600) — this is an important dynamic support zone in the short term.
Regarding the scenario, the market is on the right continuation path:
If the price continues to stay below the 4700–4800 zone, it is highly likely to retest the lower trendline around 4550–4600 by the end of the week. This is a zone where a technical reaction may occur, temporarily pausing the price and closing the weekly candle around this area.
However, if this trendline zone is clearly broken (closing below), the market will officially expand the down phase to lower zones, and next week may witness a strong continuation sell-off towards the 4400–4300 zone — where large liquidity awaits below.
Key Levels
• 4780 – 4800: Supply (FVG + Fibo + Old Demand)
• 4550 – 4600: Short-term trendline support
• 4400 – 4300: Liquidity if breakdown
Overall, the market has completed the retest phase and is returning to the main trend. The weekend is likely to close around the current support zone, but the larger structure still shows no signs of reversal.
👉 If trendline holds → slight sideways movement over the weekend
👉 If trendline breaks → next week continues BIG SHORT
LucasGrayTrading: updating multi-timeframe structure, key liquidity zones, and market scenarios ahead of the next big 1000–2000 pips breakout.
On the macro level, nothing has changed: USD remains strong after FOMC, while gold does not receive safe-haven flows despite geopolitical factors. Most importantly, it's about price action — all good news fails to lift gold back to higher levels, confirming the market is in a true markdown phase.
On the H4 chart, the downtrend structure continues to hold:
Price continuously creates BOS down
Rebounds only stop at the FVG + fibo zone
No signs of reclaiming structure
The 4780–4800 zone is now confirmed as new supply, after the old demand was broken. Right after hitting this zone, the price continues to dump strongly, showing that sellers are still in full control.
Currently, the price is moving down near the lower H4 trendline zone (~4550–4600) — this is an important dynamic support zone in the short term.
Regarding the scenario, the market is on the right continuation path:
If the price continues to stay below the 4700–4800 zone, it is highly likely to retest the lower trendline around 4550–4600 by the end of the week. This is a zone where a technical reaction may occur, temporarily pausing the price and closing the weekly candle around this area.
However, if this trendline zone is clearly broken (closing below), the market will officially expand the down phase to lower zones, and next week may witness a strong continuation sell-off towards the 4400–4300 zone — where large liquidity awaits below.
Key Levels
• 4780 – 4800: Supply (FVG + Fibo + Old Demand)
• 4550 – 4600: Short-term trendline support
• 4400 – 4300: Liquidity if breakdown
Overall, the market has completed the retest phase and is returning to the main trend. The weekend is likely to close around the current support zone, but the larger structure still shows no signs of reversal.
👉 If trendline holds → slight sideways movement over the weekend
👉 If trendline breaks → next week continues BIG SHORT
LucasGrayTrading: updating multi-timeframe structure, key liquidity zones, and market scenarios ahead of the next big 1000–2000 pips breakout.
Trade ist aktiv
GOLD 20/03 CLOSE | TRENDLINE HIT – NOW THE REAL MOVE BEGINS?At the close on 20/03, the price hit the exact H4 trendline area around 4500 after a strong downward sequence without any significant recovery. This is an important dynamic support area and also where the market temporarily paused after completing a liquidity run below.
The entire previous scenario unfolded very "cleanly":
Retest of the FVG + Fibo area → fail
Strong breakdown
Swept all liquidity below
And hit the trendline area as expected
There is no randomness here — this is structure + liquidity operating with correct logic.
Currently, at the 4500 trendline area, the price has started to show a slight recovery reaction. However, it is important to clearly understand the nature:
👉 This is just a reaction at support, not a reversal
👉 There is no bullish BOS → no confirmation of a reversal
📊 OUTLOOK FOR NEXT WEEK
The market is at a very important position — deciding whether the downtrend will continue to expand or pause for accumulation.
Scenario 1 (priority – continuation):
If the price cannot reclaim the 4700–4800 area
→ the recovery is just a pullback
→ the market will break the H4 trendline
→ opening the next decline phase to the 4400 – 4300 area (large liquidity)
This is a high probability scenario when:
The downtrend is very strong
No signs of exhaustion
Structure remains intact
Scenario 2 (secondary – technical bounce):
If the price holds the 4500 trendline area
→ a technical recovery may appear
→ Recovery targets:
4700
4800 (old supply + FVG)
However:
👉 If the structure is not broken here → continue to SELL
📍 KEY LEVELS
• 4700 – 4800: Supply / Retest zone
• 4500: Trendline support (decision)
• 4400 – 4300: Liquidity if breakdown
🧠 CONCLUSION
The market has completed a strong markdown phase and is currently pausing at the trendline.
But remember:
👉 Pause does not mean reversal
👉 When the structure has not changed → the trend is still down
Next week will be a crucial phase:
Hold the trendline → technical recovery
Break the trendline → continue BIG SHORT
Trade geschlossen: Ziel wurde erreicht
Next week will be a crucial phase:Hold the trendline → technical recovery
Break the trendline → continue BIG SHORT

Daily trend & Supply/Demand insights 📊
👉 t.me/+cZC_DmEr3OwzOTA1
High-probability zones & structured setups
Clear scenarios for better decision-making
Trade smarter with LucasGrayTrading 🎖
👉 t.me/+cZC_DmEr3OwzOTA1
High-probability zones & structured setups
Clear scenarios for better decision-making
Trade smarter with LucasGrayTrading 🎖
Haftungsausschluss
Die Informationen und Veröffentlichungen sind nicht als Finanz-, Anlage-, Handels- oder andere Arten von Ratschlägen oder Empfehlungen gedacht, die von TradingView bereitgestellt oder gebilligt werden, und stellen diese nicht dar. Lesen Sie mehr in den Nutzungsbedingungen.
Daily trend & Supply/Demand insights 📊
👉 t.me/+cZC_DmEr3OwzOTA1
High-probability zones & structured setups
Clear scenarios for better decision-making
Trade smarter with LucasGrayTrading 🎖
👉 t.me/+cZC_DmEr3OwzOTA1
High-probability zones & structured setups
Clear scenarios for better decision-making
Trade smarter with LucasGrayTrading 🎖
Haftungsausschluss
Die Informationen und Veröffentlichungen sind nicht als Finanz-, Anlage-, Handels- oder andere Arten von Ratschlägen oder Empfehlungen gedacht, die von TradingView bereitgestellt oder gebilligt werden, und stellen diese nicht dar. Lesen Sie mehr in den Nutzungsbedingungen.