
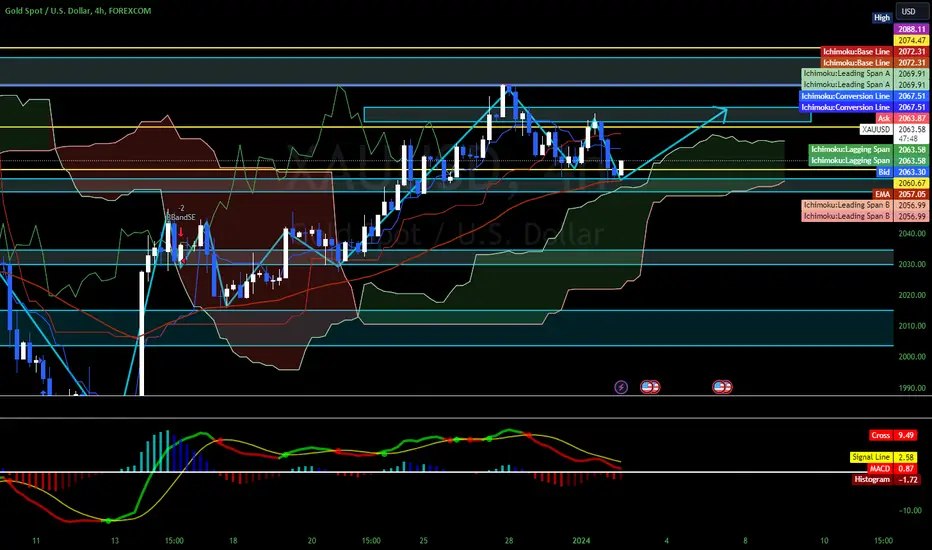
The daily chart for XAU/USD suggests intermittent recoveries despite limited directional momentum. This currency pair maintains its position above all its moving averages, with the 20-day Simple Moving Average (SMA) hovering around $2,034 USD, notably higher than longer-term averages. While technical indicators lean towards positivity, the Relative Strength Index (RSI) remains relatively low, constraining imminent upward movements.
In the near term and on the 4-hour chart, XAU/USD is neutral. The flat 20-day SMA limits upward trends, although the pair remains above the slightly rising 100 and 200-day SMAs. Technical indicators hover around the midpoint, signaling a lack of specific bias. Gold might extend its rise upon surpassing the $2,079.00 USD mark, where it encountered selling pressure last week.
Support Levels: $2,055.80, $2,046.10, $2,032.00
Resistance Levels: $2,079.00, $2,088.50, $2,100.00
In the near term and on the 4-hour chart, XAU/USD is neutral. The flat 20-day SMA limits upward trends, although the pair remains above the slightly rising 100 and 200-day SMAs. Technical indicators hover around the midpoint, signaling a lack of specific bias. Gold might extend its rise upon surpassing the $2,079.00 USD mark, where it encountered selling pressure last week.
Support Levels: $2,055.80, $2,046.10, $2,032.00
Resistance Levels: $2,079.00, $2,088.50, $2,100.00

Verbundene Veröffentlichungen
Haftungsausschluss
Die Informationen und Veröffentlichungen sind nicht als Finanz-, Anlage-, Handels- oder andere Arten von Ratschlägen oder Empfehlungen gedacht, die von TradingView bereitgestellt oder gebilligt werden, und stellen diese nicht dar. Lesen Sie mehr in den Nutzungsbedingungen.
Verbundene Veröffentlichungen
Haftungsausschluss
Die Informationen und Veröffentlichungen sind nicht als Finanz-, Anlage-, Handels- oder andere Arten von Ratschlägen oder Empfehlungen gedacht, die von TradingView bereitgestellt oder gebilligt werden, und stellen diese nicht dar. Lesen Sie mehr in den Nutzungsbedingungen.