
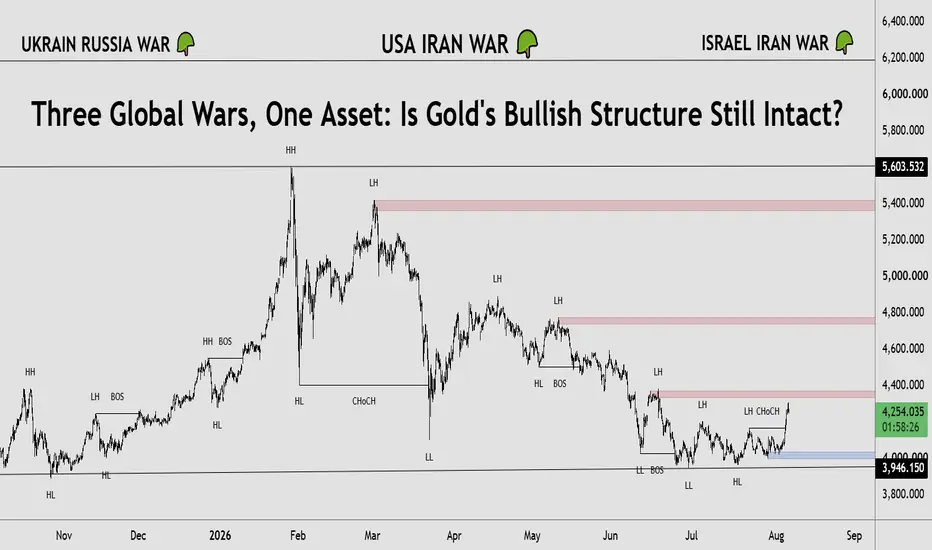
Gold has consistently been one of the world's most trusted safe-haven assets 🏆, especially during periods of geopolitical uncertainty. This chart highlights three major global conflicts—the 🇷🇺 Russia–Ukraine War, 🇺🇸 US–Iran Military Tensions, and the 🇮🇱 Israel–Iran Conflict—all of which coincided with significant moves in Gold (XAUUSD). While these events increased market volatility and influenced investor sentiment, it's important to remember that gold prices are also driven by inflation, interest rates, central bank decisions, and overall market risk appetite.
🇷🇺 Russia–Ukraine War (Safe-Haven Rally Begins)
The Russia–Ukraine War created one of the strongest bullish environments for gold in recent years. As uncertainty spread across global markets, investors looked for assets that could preserve value during economic instability.
📌 Market Impact
⚔️ Rising geopolitical uncertainty increased safe-haven demand.
📈 Gold continued printing Higher Highs (HH) and Higher Lows (HL).
💰 Institutional investors shifted capital toward defensive assets.
🛢️ Higher energy prices and inflation fears further supported gold.
🌍 Global market uncertainty strengthened long-term bullish momentum.
🇺🇸 US–Iran Military Tensions
Periods of increased tension between the United States and Iran added another layer of uncertainty to financial markets. Concerns over regional stability and oil supply disruptions encouraged investors to remain cautious.
📌 Market Impact
🚨 Increased market volatility.
🛢️ Oil market uncertainty supported safe-haven flows.
🟡 Gold attracted renewed buying interest.
📊 Price remained resilient despite temporary corrections.
💼 Investors preferred lower-risk assets during geopolitical stress.
🇮🇱 Israel–Iran Conflict
The recent Israel–Iran conflict once again reminded markets that geopolitical risk can quickly affect investor sentiment. Although Gold had already entered a corrective phase, renewed tensions helped maintain buying interest around key support areas.
📌 Market Impact
🌍 Rising geopolitical uncertainty boosted defensive positioning.
🟡 Gold remained supported as investors sought safety.
📈 Volatility increased near important technical levels.
🏦 Traders closely monitored headlines for potential market reactions.
📊 Long-Term Market Structure Analysis
Looking at the chart from a Price Action perspective, Gold initially formed a textbook bullish trend by creating a sequence of Higher Highs (HH) and Higher Lows (HL). 📈 This clearly showed that buyers were controlling the market and pushing prices higher.
🚀 Eventually, Gold reached a major peak around the 5,600 area, where bullish momentum started slowing. Instead of making another Higher High, price formed its first Lower High (LH). Shortly afterward, the market produced a Change of Character (CHoCH), suggesting that buying momentum was weakening and sellers were beginning to take control.
📉 Corrective Market Phase
After the CHoCH, Gold entered a healthy correction.
During this phase the market produced:
🔻 Multiple Lower Highs (LH)
🔻 Multiple Lower Lows (LL)
🔻 Strong seller reactions at resistance zones
🔻 Reduced bullish momentum
This correction doesn't automatically invalidate the broader bullish trend, but it does show that the market needed time to rebalance after a strong rally.
🟦 Strong Demand Zone Reaction
As price approached the 3,950–4,000 demand zone, buyers stepped back into the market.
This area shows signs of institutional buying:
✅ Strong reaction from support
✅ Selling pressure slowed noticeably
✅ Liquidity may have been collected below previous lows
✅ Buyers successfully defended an important price level
📈 Early Bullish Recovery
Recently, Gold managed to break above a nearby Lower High, which is often viewed as an early sign that bearish momentum may be weakening.
However, several important resistance zones still remain overhead.
🟢 Bullish Scenario
If buyers continue defending current support and successfully break above the highlighted resistance zones:
✔️ Higher Highs could begin forming again.
✔️ The broader bullish structure may strengthen.
✔️ Market confidence could continue improving.
🔴 Bearish Scenario
If price fails to break resistance:
❌ The correction may continue.
❌ Price could revisit lower support zones.
❌ Consolidation may continue until stronger confirmation appears.
🔑 Key Takeaways
✅ 🟡 Gold remains one of the strongest safe-haven assets during geopolitical uncertainty.
✅ 🇷🇺 The Russia–Ukraine War supported a strong bullish expansion.
✅ 🇺🇸 US–Iran tensions increased market volatility and encouraged defensive buying.
✅ 🇮🇱 The Israel–Iran conflict helped maintain safe-haven demand during the correction.
✅ 📊 The chart shows a transition from Higher Highs (HH) and Higher Lows (HL) into a CHoCH, followed by Lower Highs (LH) and Lower Lows (LL).
✅ 🟦 Price recently reacted from a major demand zone, suggesting buyers may be returning.
✅ 🚀 A decisive break above the highlighted resistance zones could strengthen the broader bullish outlook, while rejection may keep the market inside its current corrective structure until further price confirmation develops.
🇷🇺 Russia–Ukraine War (Safe-Haven Rally Begins)
The Russia–Ukraine War created one of the strongest bullish environments for gold in recent years. As uncertainty spread across global markets, investors looked for assets that could preserve value during economic instability.
📌 Market Impact
⚔️ Rising geopolitical uncertainty increased safe-haven demand.
📈 Gold continued printing Higher Highs (HH) and Higher Lows (HL).
💰 Institutional investors shifted capital toward defensive assets.
🛢️ Higher energy prices and inflation fears further supported gold.
🌍 Global market uncertainty strengthened long-term bullish momentum.
🇺🇸 US–Iran Military Tensions
Periods of increased tension between the United States and Iran added another layer of uncertainty to financial markets. Concerns over regional stability and oil supply disruptions encouraged investors to remain cautious.
📌 Market Impact
🚨 Increased market volatility.
🛢️ Oil market uncertainty supported safe-haven flows.
🟡 Gold attracted renewed buying interest.
📊 Price remained resilient despite temporary corrections.
💼 Investors preferred lower-risk assets during geopolitical stress.
🇮🇱 Israel–Iran Conflict
The recent Israel–Iran conflict once again reminded markets that geopolitical risk can quickly affect investor sentiment. Although Gold had already entered a corrective phase, renewed tensions helped maintain buying interest around key support areas.
📌 Market Impact
🌍 Rising geopolitical uncertainty boosted defensive positioning.
🟡 Gold remained supported as investors sought safety.
📈 Volatility increased near important technical levels.
🏦 Traders closely monitored headlines for potential market reactions.
📊 Long-Term Market Structure Analysis
Looking at the chart from a Price Action perspective, Gold initially formed a textbook bullish trend by creating a sequence of Higher Highs (HH) and Higher Lows (HL). 📈 This clearly showed that buyers were controlling the market and pushing prices higher.
🚀 Eventually, Gold reached a major peak around the 5,600 area, where bullish momentum started slowing. Instead of making another Higher High, price formed its first Lower High (LH). Shortly afterward, the market produced a Change of Character (CHoCH), suggesting that buying momentum was weakening and sellers were beginning to take control.
📉 Corrective Market Phase
After the CHoCH, Gold entered a healthy correction.
During this phase the market produced:
🔻 Multiple Lower Highs (LH)
🔻 Multiple Lower Lows (LL)
🔻 Strong seller reactions at resistance zones
🔻 Reduced bullish momentum
This correction doesn't automatically invalidate the broader bullish trend, but it does show that the market needed time to rebalance after a strong rally.
🟦 Strong Demand Zone Reaction
As price approached the 3,950–4,000 demand zone, buyers stepped back into the market.
This area shows signs of institutional buying:
✅ Strong reaction from support
✅ Selling pressure slowed noticeably
✅ Liquidity may have been collected below previous lows
✅ Buyers successfully defended an important price level
📈 Early Bullish Recovery
Recently, Gold managed to break above a nearby Lower High, which is often viewed as an early sign that bearish momentum may be weakening.
However, several important resistance zones still remain overhead.
🟢 Bullish Scenario
If buyers continue defending current support and successfully break above the highlighted resistance zones:
✔️ Higher Highs could begin forming again.
✔️ The broader bullish structure may strengthen.
✔️ Market confidence could continue improving.
🔴 Bearish Scenario
If price fails to break resistance:
❌ The correction may continue.
❌ Price could revisit lower support zones.
❌ Consolidation may continue until stronger confirmation appears.
🔑 Key Takeaways
✅ 🟡 Gold remains one of the strongest safe-haven assets during geopolitical uncertainty.
✅ 🇷🇺 The Russia–Ukraine War supported a strong bullish expansion.
✅ 🇺🇸 US–Iran tensions increased market volatility and encouraged defensive buying.
✅ 🇮🇱 The Israel–Iran conflict helped maintain safe-haven demand during the correction.
✅ 📊 The chart shows a transition from Higher Highs (HH) and Higher Lows (HL) into a CHoCH, followed by Lower Highs (LH) and Lower Lows (LL).
✅ 🟦 Price recently reacted from a major demand zone, suggesting buyers may be returning.
✅ 🚀 A decisive break above the highlighted resistance zones could strengthen the broader bullish outlook, while rejection may keep the market inside its current corrective structure until further price confirmation develops.
Trade ist aktiv

📲 Join Our Telegram Community
t.me/+ZroXgzEYGH4yYjc8
t.me/+ZroXgzEYGH4yYjc8
Verbundene Veröffentlichungen
Haftungsausschluss
Die Informationen und Veröffentlichungen sind nicht als Finanz-, Anlage-, Handels- oder andere Arten von Ratschlägen oder Empfehlungen gedacht, die von TradingView bereitgestellt oder gebilligt werden, und stellen diese nicht dar. Lesen Sie mehr in den Nutzungsbedingungen.
📲 Join Our Telegram Community
t.me/+ZroXgzEYGH4yYjc8
t.me/+ZroXgzEYGH4yYjc8
Verbundene Veröffentlichungen
Haftungsausschluss
Die Informationen und Veröffentlichungen sind nicht als Finanz-, Anlage-, Handels- oder andere Arten von Ratschlägen oder Empfehlungen gedacht, die von TradingView bereitgestellt oder gebilligt werden, und stellen diese nicht dar. Lesen Sie mehr in den Nutzungsbedingungen.