
Hi traders and investors!
Monthly timeframe.
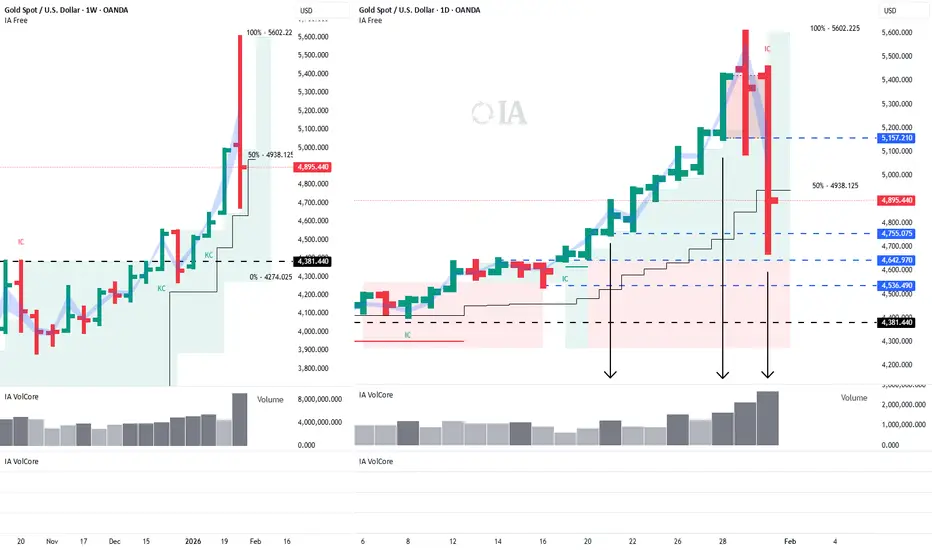
The trading volume in January 2026 exceeds all previous readings, which may indicate that the phase of rapid growth is coming to an end and the market is transitioning into consolidation or a correction.
On the monthly chart, two key levels stand out where long-term buying may be considered — but only if a valid buy pattern forms: 4435, the 50% level of the trading range, and 4381.
Daily timeframe.
The price has already reached the first key level at 4755 and reacted with a bounce. The next nearest daily levels where a buy pattern could be considered are 4642 and 4536.
At the same time, it is important to keep in mind that the January 30 candle is a seller candle with the largest volume in history, which formed a seller zone.
The lower boundary of this zone is 5157.
A strong short reaction may develop from this level, which should be taken into account when looking for long positions and setting targets.
Additionally, there is a price gap on the daily timeframe between 4642 and 4536, toward which the price is likely to gravitate.
Hourly timeframe.

A seller initiative is currently active. The key candle (the highest-volume candle within this initiative) has already been tested. The test level is 4948.
Short positions may be considered in the case of a manipulation of the 4948 level (false breakout), should this scenario unfold.
Profitable trades!
This analysis is based on the Initiative Analysis (IA) method.
Monthly timeframe.
The trading volume in January 2026 exceeds all previous readings, which may indicate that the phase of rapid growth is coming to an end and the market is transitioning into consolidation or a correction.
On the monthly chart, two key levels stand out where long-term buying may be considered — but only if a valid buy pattern forms: 4435, the 50% level of the trading range, and 4381.
Daily timeframe.
The price has already reached the first key level at 4755 and reacted with a bounce. The next nearest daily levels where a buy pattern could be considered are 4642 and 4536.
At the same time, it is important to keep in mind that the January 30 candle is a seller candle with the largest volume in history, which formed a seller zone.
The lower boundary of this zone is 5157.
A strong short reaction may develop from this level, which should be taken into account when looking for long positions and setting targets.
Additionally, there is a price gap on the daily timeframe between 4642 and 4536, toward which the price is likely to gravitate.
Hourly timeframe.
A seller initiative is currently active. The key candle (the highest-volume candle within this initiative) has already been tested. The test level is 4948.
Short positions may be considered in the case of a manipulation of the 4948 level (false breakout), should this scenario unfold.
Profitable trades!
This analysis is based on the Initiative Analysis (IA) method.

Clarity on the Chart. Smart Trading Decisions
Verbundene Veröffentlichungen
Haftungsausschluss
Die Informationen und Veröffentlichungen sind nicht als Finanz-, Anlage-, Handels- oder andere Arten von Ratschlägen oder Empfehlungen gedacht, die von TradingView bereitgestellt oder gebilligt werden, und stellen diese nicht dar. Lesen Sie mehr in den Nutzungsbedingungen.
Clarity on the Chart. Smart Trading Decisions
Verbundene Veröffentlichungen
Haftungsausschluss
Die Informationen und Veröffentlichungen sind nicht als Finanz-, Anlage-, Handels- oder andere Arten von Ratschlägen oder Empfehlungen gedacht, die von TradingView bereitgestellt oder gebilligt werden, und stellen diese nicht dar. Lesen Sie mehr in den Nutzungsbedingungen.