
Fundamental Analysis:
Gold prices gained some positive momentum during the European session on Friday, seemingly snapping a two-day losing streak.
Better-than-expected US Gross Domestic Product (GDP) data released on Thursday reinforced the view that the economy is holding up well.
Gold has shown resilience below the 34-day simple moving average (EMA) on the H1, amid expectations that the Federal Reserve (Fed) will begin its rate-cutting cycle in September. However, upside momentum appears to be limited as traders await the release of the US Personal Consumption Expenditures (PCE) Price Index later on Friday for further clues on the Fed's policy path.
Technical Analysis
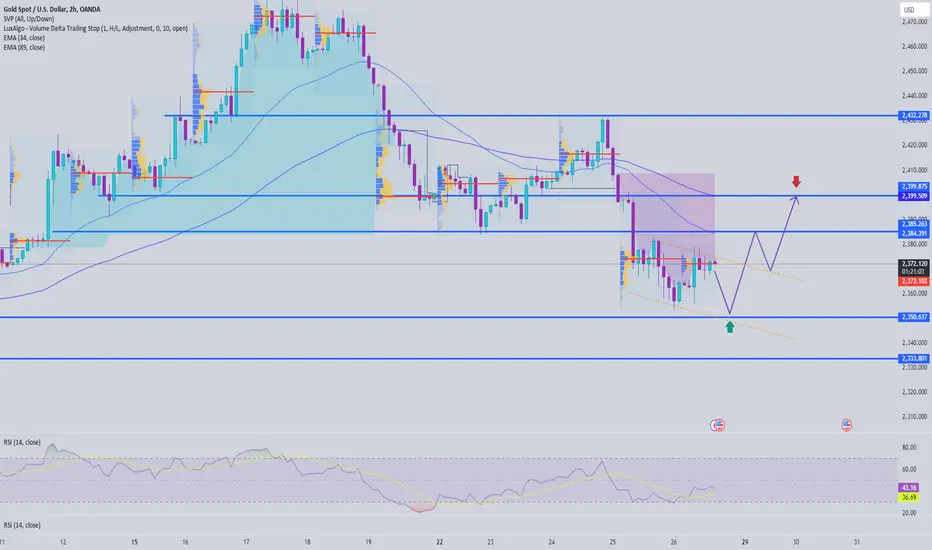
Gold is trading in a narrow range ahead of the PCE data. Initial resistance is at 2373-2375, created by the trendline and the falling channel formed in the morning. If this price channel is broken, the SELL zone at 2385 and 2400 is formed at strong resistance. In the opposite direction, the support zone may sweep and the liquidity zone at 2353 and we can scalp around the 2350 zone. The support zone is stronger at 2333. Pay attention to the strong ports to have a suitable news trading strategy.
SELL zone 2400-2398 Stoploss 2404
SELL zone 2384-2386 Stoploss 2390
BUY zone 2335 - 2333 Stoploss 2330
BUY zone 2350-2348 Stoploss 2345
Gold prices gained some positive momentum during the European session on Friday, seemingly snapping a two-day losing streak.
Better-than-expected US Gross Domestic Product (GDP) data released on Thursday reinforced the view that the economy is holding up well.
Gold has shown resilience below the 34-day simple moving average (EMA) on the H1, amid expectations that the Federal Reserve (Fed) will begin its rate-cutting cycle in September. However, upside momentum appears to be limited as traders await the release of the US Personal Consumption Expenditures (PCE) Price Index later on Friday for further clues on the Fed's policy path.
Technical Analysis
Gold is trading in a narrow range ahead of the PCE data. Initial resistance is at 2373-2375, created by the trendline and the falling channel formed in the morning. If this price channel is broken, the SELL zone at 2385 and 2400 is formed at strong resistance. In the opposite direction, the support zone may sweep and the liquidity zone at 2353 and we can scalp around the 2350 zone. The support zone is stronger at 2333. Pay attention to the strong ports to have a suitable news trading strategy.
SELL zone 2400-2398 Stoploss 2404
SELL zone 2384-2386 Stoploss 2390
BUY zone 2335 - 2333 Stoploss 2330
BUY zone 2350-2348 Stoploss 2345
Trade geschlossen: Ziel wurde erreicht
As per analysis the uptrend has been established.Trade geschlossen: Ziel wurde erreicht
hit TP 2400Trade ist aktiv

JOIN OUR FREE TELEGRAM GROUP t.me/tvstrading
MESSAGE US FOR VIP SIGNALS🏆 t.me/Leilani8597
MESSAGE US FOR VIP SIGNALS🏆 t.me/Leilani8597
Verbundene Veröffentlichungen
Haftungsausschluss
Die Informationen und Veröffentlichungen sind nicht als Finanz-, Anlage-, Handels- oder andere Arten von Ratschlägen oder Empfehlungen gedacht, die von TradingView bereitgestellt oder gebilligt werden, und stellen diese nicht dar. Lesen Sie mehr in den Nutzungsbedingungen.
JOIN OUR FREE TELEGRAM GROUP t.me/tvstrading
MESSAGE US FOR VIP SIGNALS🏆 t.me/Leilani8597
MESSAGE US FOR VIP SIGNALS🏆 t.me/Leilani8597
Verbundene Veröffentlichungen
Haftungsausschluss
Die Informationen und Veröffentlichungen sind nicht als Finanz-, Anlage-, Handels- oder andere Arten von Ratschlägen oder Empfehlungen gedacht, die von TradingView bereitgestellt oder gebilligt werden, und stellen diese nicht dar. Lesen Sie mehr in den Nutzungsbedingungen.