
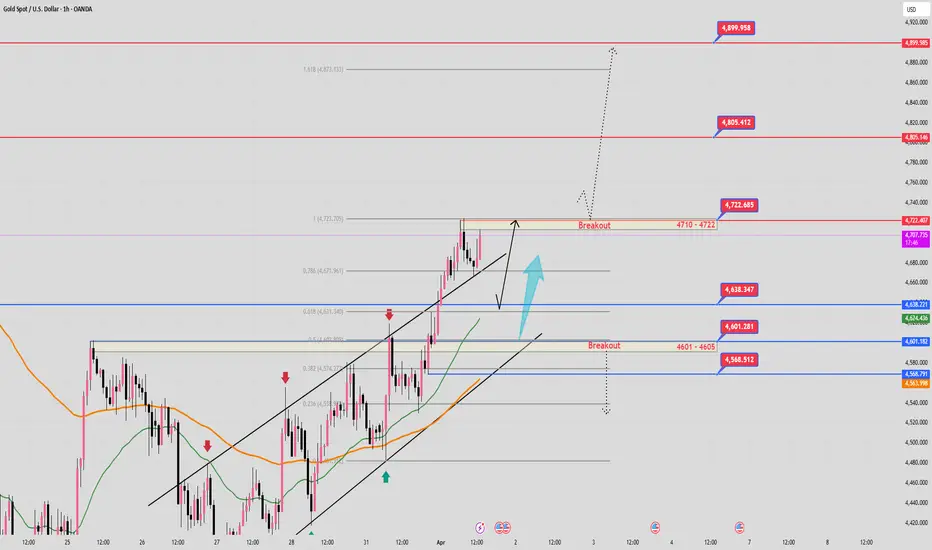
- The price is maintaining a clear uptrend structure, forming an ascending trendline and a Higher Highs - Higher Lows pattern within the channel. After a strong upward surge, the market is now entering a consolidation phase below the resistance zone (4710 - 4722), a crucial area for determining the next extended upward wave.
- The multi-timeframe EMAs (H2 - H1 - M30 - M15) are confirming a clearer upward structure as the EMA34 reverses and is above the EMA89. However, looking at the (H4) timeframe, the EMA34 remains below, indicating unclear upward momentum and the possibility of the market forming several liquidity zones before a strong breakout.
- The (4710 - 4722) zone is currently a significant resistance area; a breakout of this zone will trigger a return of upward momentum and a move towards higher resistance levels. The (4631 - 4638) and (4601 - 4605) zones are currently important support areas. A break below these zones would break the current uptrend structure, and the market is likely to continue consolidating within a large range according to the H4 chart pattern.
✅ VIEW:
1. BUY SCENARIO:
- Confirmation candle breaks through the resistance zone (4710 - 4722) and the confluence of the 100-point Fibonacci level.
=> The uptrend structure will expand.
2. BUY RETEST:
=> If the price is repeatedly rejected at the resistance zone (4710 - 4722), a short-term correction is likely to occur towards the near support levels (4631 - 4638) and further to the support zone (4601 - 4605) before resuming the current uptrend structure.
3. SELL SCENARIO:
- Price breaks through the support zone (4601 - 4605).
- Breaks through the uptrend line and simultaneously breaks through the Higher Low structure.
- The (H1) candle confirms closing below the EMA34 zone.
=> There is a possibility that the price will reverse downwards in the short term to deeper support levels.
BUY LIMIT GOLD: 4633 - 4635
STOPLOSS: 4629
✅TP1: 4638
✅TP2: 4655
SELL LIMIT GOLD: 4803 - 4805
STOPLOSS: 4809
✅TP1: 4800
✅TP2: 4780
- The multi-timeframe EMAs (H2 - H1 - M30 - M15) are confirming a clearer upward structure as the EMA34 reverses and is above the EMA89. However, looking at the (H4) timeframe, the EMA34 remains below, indicating unclear upward momentum and the possibility of the market forming several liquidity zones before a strong breakout.
- The (4710 - 4722) zone is currently a significant resistance area; a breakout of this zone will trigger a return of upward momentum and a move towards higher resistance levels. The (4631 - 4638) and (4601 - 4605) zones are currently important support areas. A break below these zones would break the current uptrend structure, and the market is likely to continue consolidating within a large range according to the H4 chart pattern.
✅ VIEW:
1. BUY SCENARIO:
- Confirmation candle breaks through the resistance zone (4710 - 4722) and the confluence of the 100-point Fibonacci level.
=> The uptrend structure will expand.
2. BUY RETEST:
=> If the price is repeatedly rejected at the resistance zone (4710 - 4722), a short-term correction is likely to occur towards the near support levels (4631 - 4638) and further to the support zone (4601 - 4605) before resuming the current uptrend structure.
3. SELL SCENARIO:
- Price breaks through the support zone (4601 - 4605).
- Breaks through the uptrend line and simultaneously breaks through the Higher Low structure.
- The (H1) candle confirms closing below the EMA34 zone.
=> There is a possibility that the price will reverse downwards in the short term to deeper support levels.
BUY LIMIT GOLD: 4633 - 4635
STOPLOSS: 4629
✅TP1: 4638
✅TP2: 4655
SELL LIMIT GOLD: 4803 - 4805
STOPLOSS: 4809
✅TP1: 4800
✅TP2: 4780

Verbundene Veröffentlichungen
Haftungsausschluss
Die Informationen und Veröffentlichungen sind nicht als Finanz-, Anlage-, Handels- oder andere Arten von Ratschlägen oder Empfehlungen gedacht, die von TradingView bereitgestellt oder gebilligt werden, und stellen diese nicht dar. Lesen Sie mehr in den Nutzungsbedingungen.
Verbundene Veröffentlichungen
Haftungsausschluss
Die Informationen und Veröffentlichungen sind nicht als Finanz-, Anlage-, Handels- oder andere Arten von Ratschlägen oder Empfehlungen gedacht, die von TradingView bereitgestellt oder gebilligt werden, und stellen diese nicht dar. Lesen Sie mehr in den Nutzungsbedingungen.