
1. Market Structure Overview
Bias: Short-term bearish → Possible bullish retracement setup
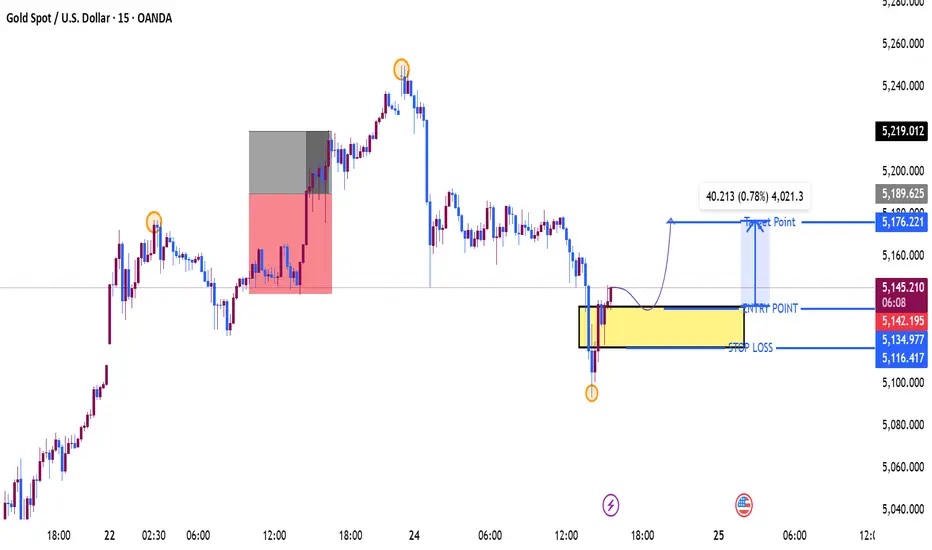
We had a strong push up (previous high marked).
Then a sharp impulsive selloff (strong displacement candle).
Price created a new lower low (circled at the bottom).
Now price is consolidating inside a demand / reaction zone (yellow box).
That shift suggests:
Intraday structure = bearish
Current move = retracement attempt
📉 2. The Sell-Side Liquidity Grab
The long lower wick (circled bottom) shows:
Liquidity taken below previous low
Stop hunts triggered
Strong rejection
This often leads to:
Short-term relief bounce before continuation
OR
Deeper retracement into supply
🟨 3. Current Zone (Yellow Box)
This looks like:
A mitigation / demand reaction area
Prior consolidation before breakdown
High-volume reaction zone
You marked:
Entry ≈ 5138
Stop ≈ 5116
Target ≈ 5176
Risk-to-reward is solid (~1:2+).
🎯 4. Target Logic (5176 Area)
Why 5176 makes sense:
Previous structure support → now resistance
Minor supply zone
Likely liquidity resting above consolidation highs
0.78% move projection
That’s a logical retracement target before continuation down.
⚠️ What Would Invalidate the Long?
Clean break and close below 5116
Strong bearish continuation candle
Failure to hold the yellow demand zone
If that happens:
→ Expect continuation toward 5090–5070 area.
🧠 Smart Money Perspective
This move looks like:
Distribution at highs
Displacement down
Liquidity sweep
Retracement to rebalance inefficiency
Then possible continuation
So this trade is likely:
Counter-trend scalp inside a bearish intraday structure.
📊 Probability Breakdown
5170–5180 reaction zone: HIGH probability rejection area
Continuation to new lows after retrace: Moderate probability
Full bullish reversal: Low probability (unless structure breaks above 5200)
💡 My Opinion
Your setup is:
✔ Structurally logical
✔ Good R:R
✔ Proper liquidity reasoning
But treat it as:
Intraday retracement trade — not trend reversal.
Bias: Short-term bearish → Possible bullish retracement setup
We had a strong push up (previous high marked).
Then a sharp impulsive selloff (strong displacement candle).
Price created a new lower low (circled at the bottom).
Now price is consolidating inside a demand / reaction zone (yellow box).
That shift suggests:
Intraday structure = bearish
Current move = retracement attempt
📉 2. The Sell-Side Liquidity Grab
The long lower wick (circled bottom) shows:
Liquidity taken below previous low
Stop hunts triggered
Strong rejection
This often leads to:
Short-term relief bounce before continuation
OR
Deeper retracement into supply
🟨 3. Current Zone (Yellow Box)
This looks like:
A mitigation / demand reaction area
Prior consolidation before breakdown
High-volume reaction zone
You marked:
Entry ≈ 5138
Stop ≈ 5116
Target ≈ 5176
Risk-to-reward is solid (~1:2+).
🎯 4. Target Logic (5176 Area)
Why 5176 makes sense:
Previous structure support → now resistance
Minor supply zone
Likely liquidity resting above consolidation highs
0.78% move projection
That’s a logical retracement target before continuation down.
⚠️ What Would Invalidate the Long?
Clean break and close below 5116
Strong bearish continuation candle
Failure to hold the yellow demand zone
If that happens:
→ Expect continuation toward 5090–5070 area.
🧠 Smart Money Perspective
This move looks like:
Distribution at highs
Displacement down
Liquidity sweep
Retracement to rebalance inefficiency
Then possible continuation
So this trade is likely:
Counter-trend scalp inside a bearish intraday structure.
📊 Probability Breakdown
5170–5180 reaction zone: HIGH probability rejection area
Continuation to new lows after retrace: Moderate probability
Full bullish reversal: Low probability (unless structure breaks above 5200)
💡 My Opinion
Your setup is:
✔ Structurally logical
✔ Good R:R
✔ Proper liquidity reasoning
But treat it as:
Intraday retracement trade — not trend reversal.
Trade geschlossen: Ziel wurde erreicht
Anmerkung
Anmerkung

join my telegram channel t.me/goldsignalicthttps://t.me/goldsignalicthttps://t.me/goldsignalict
Haftungsausschluss
Die Informationen und Veröffentlichungen sind nicht als Finanz-, Anlage-, Handels- oder andere Arten von Ratschlägen oder Empfehlungen gedacht, die von TradingView bereitgestellt oder gebilligt werden, und stellen diese nicht dar. Lesen Sie mehr in den Nutzungsbedingungen.
join my telegram channel t.me/goldsignalicthttps://t.me/goldsignalicthttps://t.me/goldsignalict
Haftungsausschluss
Die Informationen und Veröffentlichungen sind nicht als Finanz-, Anlage-, Handels- oder andere Arten von Ratschlägen oder Empfehlungen gedacht, die von TradingView bereitgestellt oder gebilligt werden, und stellen diese nicht dar. Lesen Sie mehr in den Nutzungsbedingungen.