
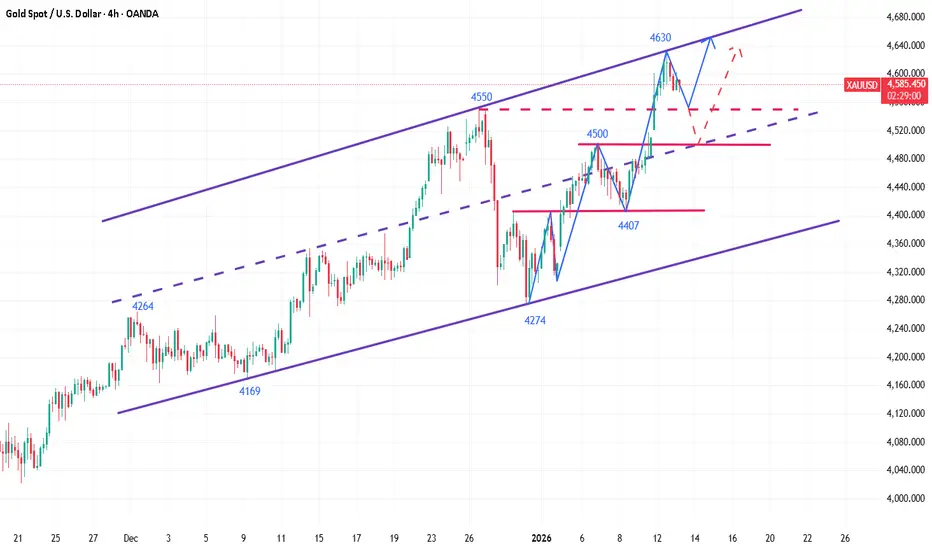
Gold Price Analysis: After a surge in the previous trading day, gold corrected and closed with a large bullish candlestick with an upper shadow. Gold once again refreshed its historical high to around 4630. While the daily new highs have become somewhat numbing, some short-term pressure is now visible after the initial rise. The first resistance level is at 4610, followed by the high of 4630. Given the significant gains this week, a pullback is possible. Therefore, trend trading may require patience, waiting for a rebound before making a decision. Chasing highs and lows is prone to losses. Currently, after breaking through the previous resistance zone on the daily chart, the candlestick continues its downward trend along the short-term moving averages. The daily chart has now shown three consecutive bullish days, indicating strong overall market performance. In terms of indicators, the 5-day and 10-day moving averages have formed a golden cross and continue to rise, maintaining a bullish moving average system. The focus on the daily chart is whether there will be a pullback followed by a second upward move.
Gold Technical Analysis: On the 4-hour chart, after the close, the price experienced a continuous pullback and is currently consolidating at a high level. Short-term focus is on the support zone around 4570. The candlestick chart is slowly breaking through short-term moving averages, which are gradually flattening out from their previous upward divergence. The short-term trend may remain in a high-level consolidation phase. Intraday support is initially expected around 4560-4550. 4560 is the low point after yesterday's initial break above 4600, while 4550 is a previous high. The potential for a breakout above this level to retest its support/resistance potential is crucial. On the upside, initial resistance is around yesterday's high of 4630. A decisive break above this level could lead to further resistance in the 4650-4660 area. This area, formed by connecting the highs of November 13th and December 26th, 2025, represents a key resistance zone at the current stage. While the overall bullish trend remains unchanged for today's trading, a short-term shorting strategy is still possible. The primary focus today is on entering long positions near the first resistance level of 4630, waiting for a pullback. If shorting opportunities are limited, long positions can be initiated directly. In summary, today's gold trading strategy is to primarily buy on dips and secondarily sell on rallies. The key resistance level to watch in the short term is around 4630-4650, while the key support level is around 4570-4550. Please keep up with the pace of the market.
Gold Technical Analysis: On the 4-hour chart, after the close, the price experienced a continuous pullback and is currently consolidating at a high level. Short-term focus is on the support zone around 4570. The candlestick chart is slowly breaking through short-term moving averages, which are gradually flattening out from their previous upward divergence. The short-term trend may remain in a high-level consolidation phase. Intraday support is initially expected around 4560-4550. 4560 is the low point after yesterday's initial break above 4600, while 4550 is a previous high. The potential for a breakout above this level to retest its support/resistance potential is crucial. On the upside, initial resistance is around yesterday's high of 4630. A decisive break above this level could lead to further resistance in the 4650-4660 area. This area, formed by connecting the highs of November 13th and December 26th, 2025, represents a key resistance zone at the current stage. While the overall bullish trend remains unchanged for today's trading, a short-term shorting strategy is still possible. The primary focus today is on entering long positions near the first resistance level of 4630, waiting for a pullback. If shorting opportunities are limited, long positions can be initiated directly. In summary, today's gold trading strategy is to primarily buy on dips and secondarily sell on rallies. The key resistance level to watch in the short term is around 4630-4650, while the key support level is around 4570-4550. Please keep up with the pace of the market.
Trade ist aktiv
Trading is actually not as complicated as you might imagine. The real challenge isn't the market itself, but rather maintaining focus and passion over the long term. When you approach the market correctly, the results will naturally follow. I don't chase emotions or indulge in fancy rhetoric; I only make genuine trading judgments, focusing on a clear rhythm and executable logic. There are no perpetual bulls or perpetual bears in the market, only the most suitable direction to participate in at any given moment. Understand the rhythm, follow the trend, remain calm amidst change, and adhere to discipline amidst volatility—this is the true core value of trading. If you still feel lost in the market, or struggle to adjust your mindset and strategies in time when the rhythm shifts, feel free to follow the tips below for more specific operational ideas and real-time strategy updates. Let's use rationality and execution to steadily seize our opportunities in uncertain market conditions.Trade geschlossen: Ziel wurde erreicht
The final hurdle in trading is human nature. Many people possess extensive technical knowledge and even a decent trading system, yet they still struggle to achieve consistent profits. This is because they are trapped by the limitations of their systems, neglecting the underlying logic and deeper influencing factors. Trading is not merely a technical issue but also a cognitive one. Truly mature traders must be clear-headed and decisive in every buy and sell decision, carefully analyzing current market trends to determine if they align with their profit model. If they do, they execute; if not, they patiently wait. The key to trading is not seizing every opportunity, but controlling one's emotions and steadying one's actions. When a true opportunity arises, one must act decisively without emotional fluctuations. Only in this way can one achieve truly stable profits.
Verbundene Veröffentlichungen
Haftungsausschluss
Die Informationen und Veröffentlichungen sind nicht als Finanz-, Anlage-, Handels- oder andere Arten von Ratschlägen oder Empfehlungen gedacht, die von TradingView bereitgestellt oder gebilligt werden, und stellen diese nicht dar. Lesen Sie mehr in den Nutzungsbedingungen.
Verbundene Veröffentlichungen
Haftungsausschluss
Die Informationen und Veröffentlichungen sind nicht als Finanz-, Anlage-, Handels- oder andere Arten von Ratschlägen oder Empfehlungen gedacht, die von TradingView bereitgestellt oder gebilligt werden, und stellen diese nicht dar. Lesen Sie mehr in den Nutzungsbedingungen.