
🔍 1. Technical Analysis (5-Minute Chart Review)
Price Structure
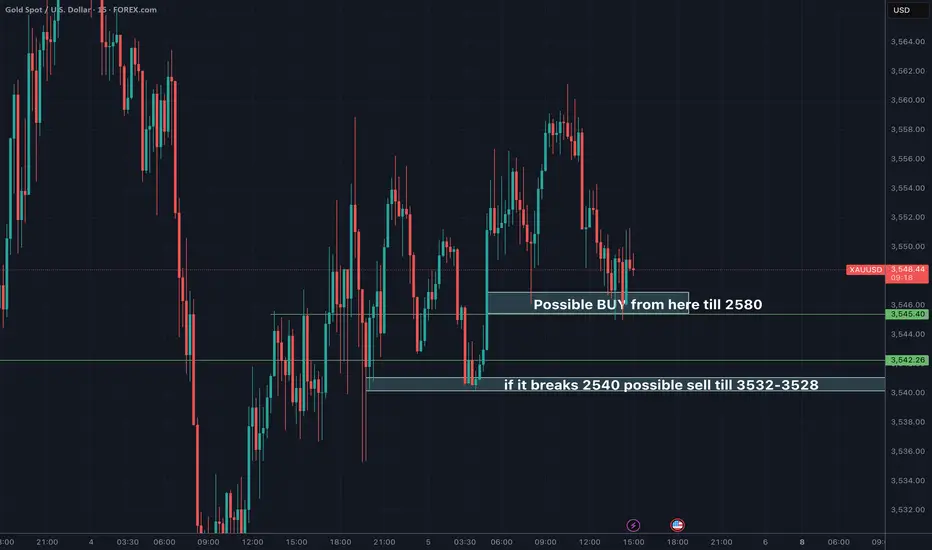
Price is currently at $3,549.71, having bounced twice off the $3,545.40 support and lower $3,542.26 support.
We're seeing short-term bullish rejection wicks near those support levels, suggesting buying interest.
Trend
On this intraday (5-min) chart: The market made a lower high and lower low, indicating a short-term downtrend, but this is being tested.
There's a potential reversal pattern forming (double bottom or inverse head-and-shoulders near $3,542 area).
Key Levels
Support:
$3,545.40 → Recent double rejection, acting as short-term support
$3,542.26 → Stronger horizontal support, tested multiple times
Resistance:
$3,551.30–$3,552.00 → Immediate resistance (previous lower high)
$3,557.00–$3,560.00 → Major intraday resistance (top before breakdown)
Indicators (Implied)
You have the "Buffett-Ackman RSI Support/Resistance Strategy" on — not shown directly, but the levels drawn seem to support RSI-based oversold zones near support.
Short-term candles are shrinking in body with long wicks → sign of buyer absorption of selling pressure.
🌐 2. Fundamental Analysis (As of Sept 5, 2025)
Macro Backdrop
USD Strength: Likely remains strong due to higher interest rates by the Fed (continuing 2024 tightening).
Inflation: If inflation remains sticky, it supports USD but also Gold due to its inflation hedge.
Geo-Political Risks: Any tensions (Russia/Ukraine, China/Taiwan) can spike gold as a safe haven.
Bond Yields: Rising yields pressure Gold due to opportunity cost of holding it. If yields cool, gold rallies.
Upcoming Events to Watch
US NFP (Jobs Data): If weak, USD drops and Gold may pump.
Fed Commentary: If dovish, bullish for gold.
CPI or PCE Inflation Data: Any downside surprise could trigger upside in Gold.
✅ 3. Trade Plan (Pro Setup)
🟢 Trade Idea: Long (Buy) XAUUSD – Countertrend Intraday Reversal
Entry: $3,546.00 (Buy limit just above the strong support zone)
Stop Loss: $3,540.50 (Below key swing low and liquidity zone)
Take Profit 1: $3,552.00 (Intraday resistance)
Take Profit 2: $3,557.00 (Key structure resistance)
Risk/Reward: ~1:2.5 minimum
🛡️ Reasoning:
Bullish rejection wicks on support zone ($3,542–$3,545)
Possible RSI oversold condition
Double bottom / consolidation = base formation
Risk tightly defined below structure
Fed uncertainty and safe haven bids can cause sudden spikes
⚠️ Alternative Scenario – If It Breaks Down
If $3,542.00 breaks convincingly with volume, then:
Flip bias short
Sell Below: $3,540.00
Target: $3,532.00–$3,528.00
Stop: $3,546.00
Reason: Clear breakdown of structure with liquidity hunt done
Price Structure
Price is currently at $3,549.71, having bounced twice off the $3,545.40 support and lower $3,542.26 support.
We're seeing short-term bullish rejection wicks near those support levels, suggesting buying interest.
Trend
On this intraday (5-min) chart: The market made a lower high and lower low, indicating a short-term downtrend, but this is being tested.
There's a potential reversal pattern forming (double bottom or inverse head-and-shoulders near $3,542 area).
Key Levels
Support:
$3,545.40 → Recent double rejection, acting as short-term support
$3,542.26 → Stronger horizontal support, tested multiple times
Resistance:
$3,551.30–$3,552.00 → Immediate resistance (previous lower high)
$3,557.00–$3,560.00 → Major intraday resistance (top before breakdown)
Indicators (Implied)
You have the "Buffett-Ackman RSI Support/Resistance Strategy" on — not shown directly, but the levels drawn seem to support RSI-based oversold zones near support.
Short-term candles are shrinking in body with long wicks → sign of buyer absorption of selling pressure.
🌐 2. Fundamental Analysis (As of Sept 5, 2025)
Macro Backdrop
USD Strength: Likely remains strong due to higher interest rates by the Fed (continuing 2024 tightening).
Inflation: If inflation remains sticky, it supports USD but also Gold due to its inflation hedge.
Geo-Political Risks: Any tensions (Russia/Ukraine, China/Taiwan) can spike gold as a safe haven.
Bond Yields: Rising yields pressure Gold due to opportunity cost of holding it. If yields cool, gold rallies.
Upcoming Events to Watch
US NFP (Jobs Data): If weak, USD drops and Gold may pump.
Fed Commentary: If dovish, bullish for gold.
CPI or PCE Inflation Data: Any downside surprise could trigger upside in Gold.
✅ 3. Trade Plan (Pro Setup)
🟢 Trade Idea: Long (Buy) XAUUSD – Countertrend Intraday Reversal
Entry: $3,546.00 (Buy limit just above the strong support zone)
Stop Loss: $3,540.50 (Below key swing low and liquidity zone)
Take Profit 1: $3,552.00 (Intraday resistance)
Take Profit 2: $3,557.00 (Key structure resistance)
Risk/Reward: ~1:2.5 minimum
🛡️ Reasoning:
Bullish rejection wicks on support zone ($3,542–$3,545)
Possible RSI oversold condition
Double bottom / consolidation = base formation
Risk tightly defined below structure
Fed uncertainty and safe haven bids can cause sudden spikes
⚠️ Alternative Scenario – If It Breaks Down
If $3,542.00 breaks convincingly with volume, then:
Flip bias short
Sell Below: $3,540.00
Target: $3,532.00–$3,528.00
Stop: $3,546.00
Reason: Clear breakdown of structure with liquidity hunt done

Haftungsausschluss
Die Informationen und Veröffentlichungen sind nicht als Finanz-, Anlage-, Handels- oder andere Arten von Ratschlägen oder Empfehlungen gedacht, die von TradingView bereitgestellt oder gebilligt werden, und stellen diese nicht dar. Lesen Sie mehr in den Nutzungsbedingungen.
Haftungsausschluss
Die Informationen und Veröffentlichungen sind nicht als Finanz-, Anlage-, Handels- oder andere Arten von Ratschlägen oder Empfehlungen gedacht, die von TradingView bereitgestellt oder gebilligt werden, und stellen diese nicht dar. Lesen Sie mehr in den Nutzungsbedingungen.