
1. The Macro Context (The "Why") 🌍
Hi traders! Before looking at the candles, let's look at the money. My fundamental scoring table speaks clearly: there is a huge differential that we cannot ignore.
Key Factor Analysis:
🏦 Rate Expectations (TIPS 10Y): Explanation: Real US rates remain elevated near 1.95%. While normally bearish, the market is currently prioritizing Gold's safe-haven status. Score Gold: -1
🎈 Central Banks: Explanation: Continuous net purchases from central banks (Poland, China, etc.) are creating a long-term price floor through accumulation. Score Gold: +3
📈 GLD Fund Flows: Explanation: The breakout above $5k has triggered massive institutional FOMO, with ETF inflows up 8.75% in a single week. Score Gold: +3
🏭 Physical Demand (Asia): Explanation: At these record price levels, jewelry demand in India and China is seeing a physiological slowdown. Score Gold: -2
⚖️ Risk Sentiment (Geopolitics): Explanation: High uncertainty and trade tensions (Trump vs. Canada/China) are fueling a Risk-Off regime and safe-haven demand. Score Gold: +3
🗞️ Seasonality: Explanation: January is historically a top-performing month for Gold due to early-year portfolio rebalancing. Score Gold: +2
Currency Score Summary: Total Score Gold: +9 (Strong) Total Score USD: +1 (Neutral)
Synthesis: Gold (Strong, Score +9): Driven by massive institutional flows and geopolitical hedging despite weak physical demand. USD (Neutral, Score +1): Struggling to capitalize on yields, providing relative support to Gold. Conclusion: With this scenario, we are only looking for Long setups. Going against this bias would be statistical suicide.
2. The Technical Setup (The "Where") 📉
Timeframe: 4H | Pair: XAUUSD
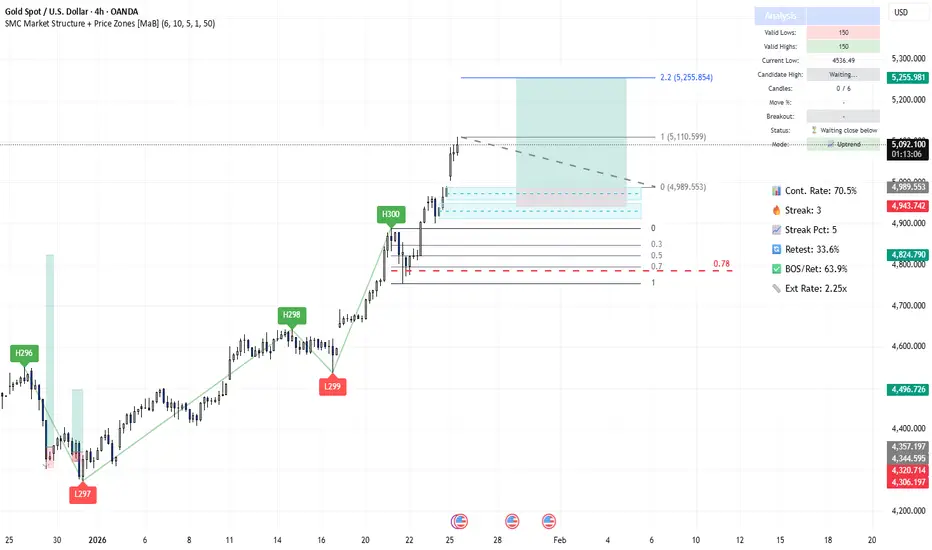
The SMC Market Structure + Price Zones [MaB] indicator gave us the confirmation we needed for our statistical edge. Look at the dashboard on the right, numbers don't lie:
🚀 Continuation Rate (70.5%): We are well above the 60% threshold. This tells us the market is in a healthy, directional trend. Statistically, betting on continuation pays off more than looking for a reversal.
🔥 Streak (3) & Streak Pct (5): We are at the 3rd consecutive impulse. It's a fresh move (5th percentile of trend extension), so while we watch our stops, as long as the music plays, we dance.
🔄 Retest (33.6%): The indicator tells us that statistically, when price creates a new Break of Structure (BOS), it retraces into the previous zone only 33.6% of the time. Therefore, it pays to try an entry near the immediate demand zone if we don't want to risk missing the entry.
💥 BOS/Ret Rate (63.9%): This parameter tells us that once price retraces inside the previous zone, it has a 63.9% probability of reacting and creating a new BOS.
🎯 Extension Rate (2.25x): The algorithm projects an ambitious target. We expect this move to extend 2.25 times the current pullback leg.
3. Execution Plan on Chart
Moving to the chart, the SMC Market Structure + Price Zones [MaB] indicator supports us in pinpointing liquidity to define entry and stop loss:
Entry and Stop Loss: We place a limit entry in the Demand Zone 4H (Blue Band) and the stop loss a few pips below the zone.
Take Profit: We leverage the asset's statistical analysis offered by the Extension Rate and place the target at the 2.25x extension level.
Trade Parameters: Entry Price: 4989.553 Stop Loss: 4943.742 Take Profit: 5255.981
⚠️ Disclaimer: This analysis is based on a proprietary algorithm and is shared exclusively for educational and didactic purposes. It does not constitute financial advice or investment solicitation in any way. Trading involves significant risk.
Hi traders! Before looking at the candles, let's look at the money. My fundamental scoring table speaks clearly: there is a huge differential that we cannot ignore.
Key Factor Analysis:
🏦 Rate Expectations (TIPS 10Y): Explanation: Real US rates remain elevated near 1.95%. While normally bearish, the market is currently prioritizing Gold's safe-haven status. Score Gold: -1
🎈 Central Banks: Explanation: Continuous net purchases from central banks (Poland, China, etc.) are creating a long-term price floor through accumulation. Score Gold: +3
📈 GLD Fund Flows: Explanation: The breakout above $5k has triggered massive institutional FOMO, with ETF inflows up 8.75% in a single week. Score Gold: +3
🏭 Physical Demand (Asia): Explanation: At these record price levels, jewelry demand in India and China is seeing a physiological slowdown. Score Gold: -2
⚖️ Risk Sentiment (Geopolitics): Explanation: High uncertainty and trade tensions (Trump vs. Canada/China) are fueling a Risk-Off regime and safe-haven demand. Score Gold: +3
🗞️ Seasonality: Explanation: January is historically a top-performing month for Gold due to early-year portfolio rebalancing. Score Gold: +2
Currency Score Summary: Total Score Gold: +9 (Strong) Total Score USD: +1 (Neutral)
Synthesis: Gold (Strong, Score +9): Driven by massive institutional flows and geopolitical hedging despite weak physical demand. USD (Neutral, Score +1): Struggling to capitalize on yields, providing relative support to Gold. Conclusion: With this scenario, we are only looking for Long setups. Going against this bias would be statistical suicide.
2. The Technical Setup (The "Where") 📉
Timeframe: 4H | Pair: XAUUSD
The SMC Market Structure + Price Zones [MaB] indicator gave us the confirmation we needed for our statistical edge. Look at the dashboard on the right, numbers don't lie:
🚀 Continuation Rate (70.5%): We are well above the 60% threshold. This tells us the market is in a healthy, directional trend. Statistically, betting on continuation pays off more than looking for a reversal.
🔥 Streak (3) & Streak Pct (5): We are at the 3rd consecutive impulse. It's a fresh move (5th percentile of trend extension), so while we watch our stops, as long as the music plays, we dance.
🔄 Retest (33.6%): The indicator tells us that statistically, when price creates a new Break of Structure (BOS), it retraces into the previous zone only 33.6% of the time. Therefore, it pays to try an entry near the immediate demand zone if we don't want to risk missing the entry.
💥 BOS/Ret Rate (63.9%): This parameter tells us that once price retraces inside the previous zone, it has a 63.9% probability of reacting and creating a new BOS.
🎯 Extension Rate (2.25x): The algorithm projects an ambitious target. We expect this move to extend 2.25 times the current pullback leg.
3. Execution Plan on Chart
Moving to the chart, the SMC Market Structure + Price Zones [MaB] indicator supports us in pinpointing liquidity to define entry and stop loss:
Entry and Stop Loss: We place a limit entry in the Demand Zone 4H (Blue Band) and the stop loss a few pips below the zone.
Take Profit: We leverage the asset's statistical analysis offered by the Extension Rate and place the target at the 2.25x extension level.
Trade Parameters: Entry Price: 4989.553 Stop Loss: 4943.742 Take Profit: 5255.981
⚠️ Disclaimer: This analysis is based on a proprietary algorithm and is shared exclusively for educational and didactic purposes. It does not constitute financial advice or investment solicitation in any way. Trading involves significant risk.

Trading indicators development focused on Smart Money Concepts (SMC), market structure analysis, and liquidity zones.
WEBSITE: mab-arreca.com/
WHOP: whop.com/mab-9cb1/
YOUTUBE: youtube.com/@MaB.arreca
WEBSITE: mab-arreca.com/
WHOP: whop.com/mab-9cb1/
YOUTUBE: youtube.com/@MaB.arreca
Verbundene Veröffentlichungen
Haftungsausschluss
Die Informationen und Veröffentlichungen sind nicht als Finanz-, Anlage-, Handels- oder andere Arten von Ratschlägen oder Empfehlungen gedacht, die von TradingView bereitgestellt oder gebilligt werden, und stellen diese nicht dar. Lesen Sie mehr in den Nutzungsbedingungen.
Trading indicators development focused on Smart Money Concepts (SMC), market structure analysis, and liquidity zones.
WEBSITE: mab-arreca.com/
WHOP: whop.com/mab-9cb1/
YOUTUBE: youtube.com/@MaB.arreca
WEBSITE: mab-arreca.com/
WHOP: whop.com/mab-9cb1/
YOUTUBE: youtube.com/@MaB.arreca
Verbundene Veröffentlichungen
Haftungsausschluss
Die Informationen und Veröffentlichungen sind nicht als Finanz-, Anlage-, Handels- oder andere Arten von Ratschlägen oder Empfehlungen gedacht, die von TradingView bereitgestellt oder gebilligt werden, und stellen diese nicht dar. Lesen Sie mehr in den Nutzungsbedingungen.