
Current price: ~4,342
Bias: 🔴 Bearish below 4,443
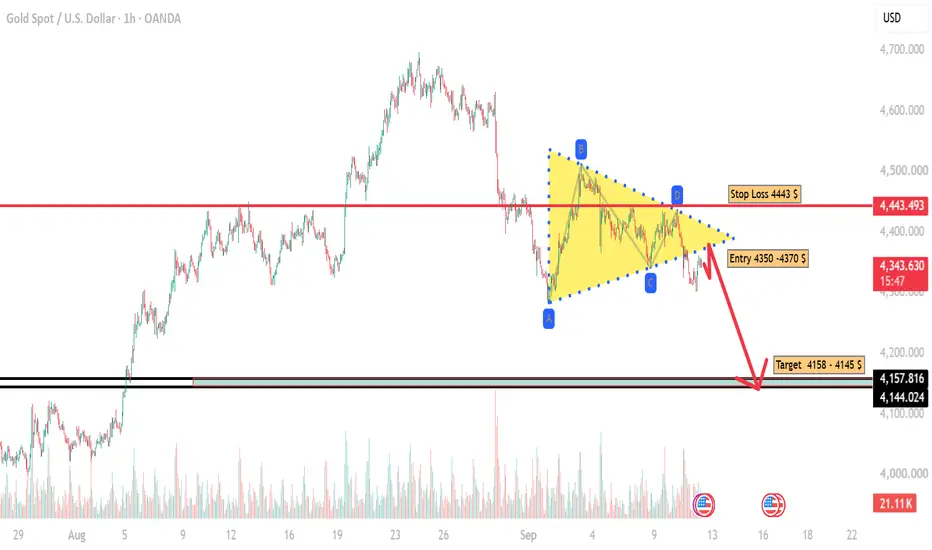
The 1H chart shows a contracting symmetrical triangle following the sharp decline from the 4,500 area. Price has completed the A–B–C–D structure and is now breaking below the lower boundary, increasing the probability of a bearish continuation.
📉 Bearish Setup
Entry Zone: 4,350 – 4,370
This area can act as a retest/supply zone after the breakdown.
Stop Loss: 4,443
A sustained move above 4,443 would invalidate the bearish setup and indicate a potential recovery back toward the upper part of the pattern.
Targets:
🎯 TP1: 4,158
🎯 TP2: 4,145
The 4,145–4,158 zone is particularly important because it represents the major horizontal support shown on the chart.
🔑 Key Levels
Level Role
4,443 Major resistance / invalidation
4,400–4,420 Near-term resistance
4,350–4,370 Short entry / retest zone
4,300 First psychological support
4,158–4,145 Major target/support zone
📊 Risk/Reward
Using the midpoint entry around 4,360:
Risk: 4,443 − 4,360 = 83 points
Reward to 4,158: 202 points
➡️ Approx. R:R = 1 : 2.43
To TP2 at 4,145, the R:R improves to roughly 1 : 2.59.
🧠 TradingView Interpretation
The important confirmation is not simply the price touching 4,350. The stronger bearish signal is:
Triangle breakdown → retest of 4,350–4,370 → rejection → continuation lower.
If Gold manages to reclaim 4,400 and especially closes a 1H candle above 4,443, the bearish thesis becomes invalid.
Trading plan:
SELL 4,350–4,370
SL 4,443
TP1 4,158
TP2 4,145
Overall: 🔴 Bearish continuation setup, with 4,443 as the key line in the sand.
Bias: 🔴 Bearish below 4,443
The 1H chart shows a contracting symmetrical triangle following the sharp decline from the 4,500 area. Price has completed the A–B–C–D structure and is now breaking below the lower boundary, increasing the probability of a bearish continuation.
📉 Bearish Setup
Entry Zone: 4,350 – 4,370
This area can act as a retest/supply zone after the breakdown.
Stop Loss: 4,443
A sustained move above 4,443 would invalidate the bearish setup and indicate a potential recovery back toward the upper part of the pattern.
Targets:
🎯 TP1: 4,158
🎯 TP2: 4,145
The 4,145–4,158 zone is particularly important because it represents the major horizontal support shown on the chart.
🔑 Key Levels
Level Role
4,443 Major resistance / invalidation
4,400–4,420 Near-term resistance
4,350–4,370 Short entry / retest zone
4,300 First psychological support
4,158–4,145 Major target/support zone
📊 Risk/Reward
Using the midpoint entry around 4,360:
Risk: 4,443 − 4,360 = 83 points
Reward to 4,158: 202 points
➡️ Approx. R:R = 1 : 2.43
To TP2 at 4,145, the R:R improves to roughly 1 : 2.59.
🧠 TradingView Interpretation
The important confirmation is not simply the price touching 4,350. The stronger bearish signal is:
Triangle breakdown → retest of 4,350–4,370 → rejection → continuation lower.
If Gold manages to reclaim 4,400 and especially closes a 1H candle above 4,443, the bearish thesis becomes invalid.
Trading plan:
SELL 4,350–4,370
SL 4,443
TP1 4,158
TP2 4,145
Overall: 🔴 Bearish continuation setup, with 4,443 as the key line in the sand.
Trade ist aktiv

Haftungsausschluss
Die Informationen und Veröffentlichungen sind nicht als Finanz-, Anlage-, Handels- oder andere Arten von Ratschlägen oder Empfehlungen gedacht, die von TradingView bereitgestellt oder gebilligt werden, und stellen diese nicht dar. Lesen Sie mehr in den Nutzungsbedingungen.
Haftungsausschluss
Die Informationen und Veröffentlichungen sind nicht als Finanz-, Anlage-, Handels- oder andere Arten von Ratschlägen oder Empfehlungen gedacht, die von TradingView bereitgestellt oder gebilligt werden, und stellen diese nicht dar. Lesen Sie mehr in den Nutzungsbedingungen.