
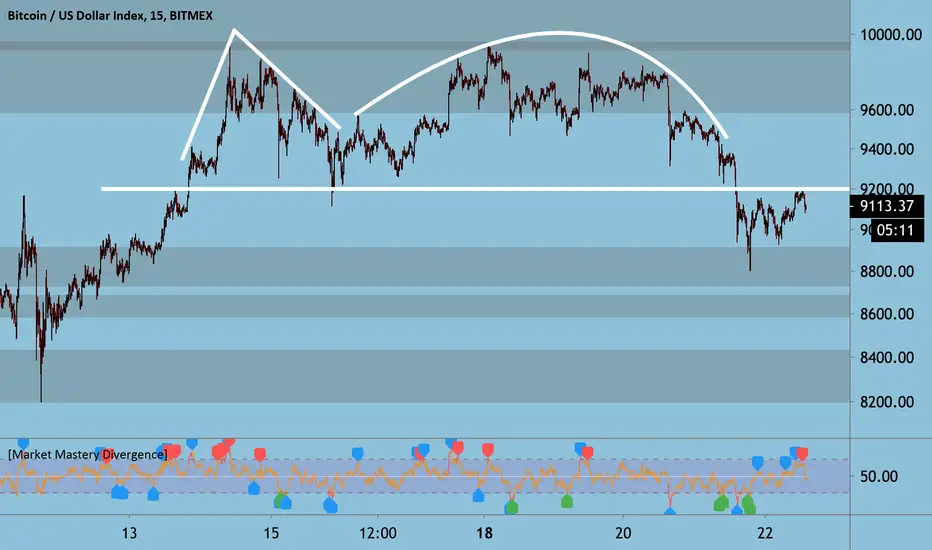
Possible adam and eve top on BTC 15m, this could be the moment bitcoin stops floating between bullish and bearish and dumps.
Looks like its rejecting now off the neckline. Need to get above 9300 or so then this pattern will be consider INVALIDATED.
There is also a rising wedge on the 5 minute chart.
Looks like its rejecting now off the neckline. Need to get above 9300 or so then this pattern will be consider INVALIDATED.
There is also a rising wedge on the 5 minute chart.
Anmerkung
Bulls attempting to reclaim the neckline here, its at 9205 according to our chart, watch for a break above this level then confirmation of the neckline as support again for a shot at pattern failure setup or rejection for the pattern to play out.Anmerkung
Still showing bearish signs hereFirst of all the adam and eve
H&S/ Rising wedge on the 5 minute- If the H&S breaks out will lead us to a 5th touch of a possible rising wedge (a breakout down of the rising wedge leads to successful bearish retest of the adam & eve)
(See attached image)
Possible bear flag
(measured move hits RIGHT ON a weekly orderblock)
All smaller timeframe bearish setups showing atm are invalidated once we start trading above the golden fib (we are just under it now see below chart) there is a possible BARR bottom pattern and the measured move target is around 9500.
Anmerkung
Possible descending channel on BTC 4HR, the nexus indicator (swing indicator) shows a red sell signal also.This can take us to the weekly orderblock below (grey area) or if it invalidates we can see a break of the resistance and a bullish retest off the channel.
Anmerkung
The adam and eve and flags etc all seem invalidated but could of been a shakeout. Right under the golden fib now so lets see what happens.Anmerkung
Playing out now.. Nice bearish retest

Verbundene Veröffentlichungen
Haftungsausschluss
Die Informationen und Veröffentlichungen sind nicht als Finanz-, Anlage-, Handels- oder andere Arten von Ratschlägen oder Empfehlungen gedacht, die von TradingView bereitgestellt oder gebilligt werden, und stellen diese nicht dar. Lesen Sie mehr in den Nutzungsbedingungen.
Verbundene Veröffentlichungen
Haftungsausschluss
Die Informationen und Veröffentlichungen sind nicht als Finanz-, Anlage-, Handels- oder andere Arten von Ratschlägen oder Empfehlungen gedacht, die von TradingView bereitgestellt oder gebilligt werden, und stellen diese nicht dar. Lesen Sie mehr in den Nutzungsbedingungen.