
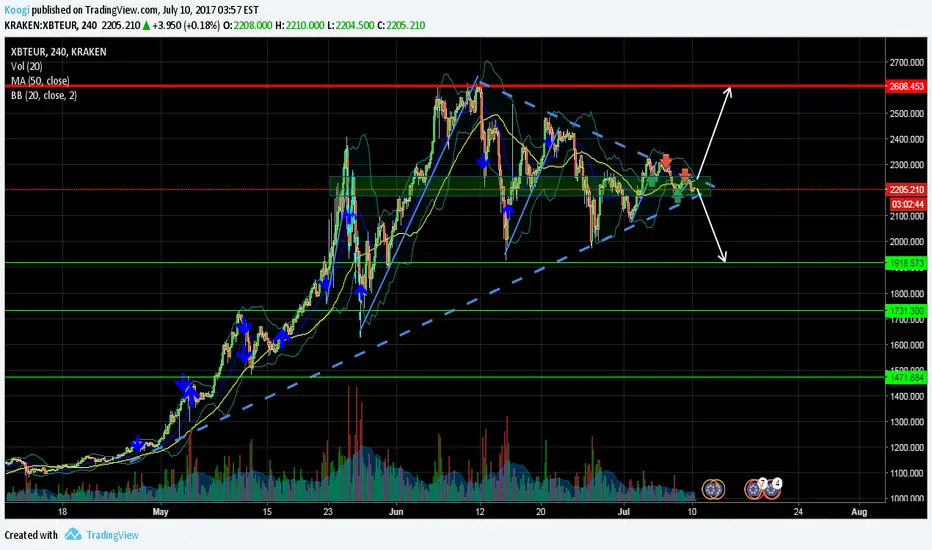
I have been trying to catch the break out for the last few days with a tight stop loss just in case it goes the other way which is also very possible. The pull back from all time highs hasn't been strong enough to suggest a reversal in trend so I believe this to be a continuation pattern. I will be waiting for break out confirmation before I get in again though.
The pattern is a symmetrical triangle so see the below link for more info.
stockcharts.com/school/doku.php?id=chart_school:chart_analysis:chart_patterns:symmetrical_triangle_continuation
The pattern is a symmetrical triangle so see the below link for more info.
stockcharts.com/school/doku.php?id=chart_school:chart_analysis:chart_patterns:symmetrical_triangle_continuation
Anmerkung
Break out to the down side confirmed. :-(
Haftungsausschluss
Die Informationen und Veröffentlichungen sind nicht als Finanz-, Anlage-, Handels- oder andere Arten von Ratschlägen oder Empfehlungen gedacht, die von TradingView bereitgestellt oder gebilligt werden, und stellen diese nicht dar. Lesen Sie mehr in den Nutzungsbedingungen.
Haftungsausschluss
Die Informationen und Veröffentlichungen sind nicht als Finanz-, Anlage-, Handels- oder andere Arten von Ratschlägen oder Empfehlungen gedacht, die von TradingView bereitgestellt oder gebilligt werden, und stellen diese nicht dar. Lesen Sie mehr in den Nutzungsbedingungen.