
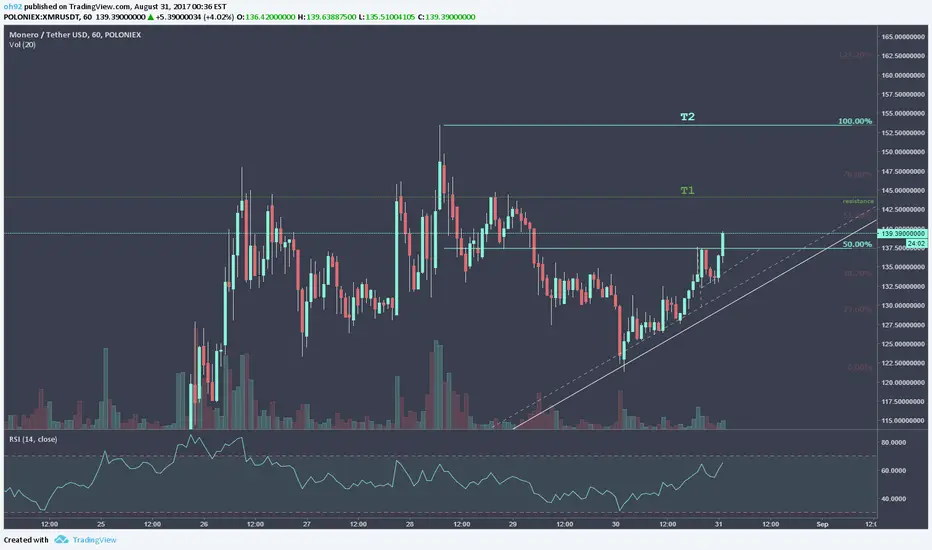
Once again XMR has bounced off its long term trendline at $122.
This indicates that we are still in a very bullish market and we will likely be test the previous high of $153 again.
As long as we are able to close a candle above the 50% fib level, we should see a steady push of momentum to the first target of $143. This target is historical resistance level which people will likely take profit at.
If we are then able to push through the historical resistance level, I see blue skies until we hit the previous high of $153 again.
If we push through the 50% level and fail to hit the first target, it would be an indication of lack of momentum. This means we would likely retest the long term trendline and I would caution holding long term.
I am hoping for the best here! Wish you all luck!
DISCLAIMER:
Please note I am only providing my own trading information for your benefit and insight to my trading techniques, you should do your own due diligence and not take this information as a trade signal.
This indicates that we are still in a very bullish market and we will likely be test the previous high of $153 again.
As long as we are able to close a candle above the 50% fib level, we should see a steady push of momentum to the first target of $143. This target is historical resistance level which people will likely take profit at.
If we are then able to push through the historical resistance level, I see blue skies until we hit the previous high of $153 again.
If we push through the 50% level and fail to hit the first target, it would be an indication of lack of momentum. This means we would likely retest the long term trendline and I would caution holding long term.
I am hoping for the best here! Wish you all luck!
DISCLAIMER:
Please note I am only providing my own trading information for your benefit and insight to my trading techniques, you should do your own due diligence and not take this information as a trade signal.
Anmerkung
Additional levels:
Creator of DepthHouse Indicators on TradingView!
↣ depthhouse.com/
↣ depthhouse.com/
Haftungsausschluss
Die Informationen und Veröffentlichungen sind nicht als Finanz-, Anlage-, Handels- oder andere Arten von Ratschlägen oder Empfehlungen gedacht, die von TradingView bereitgestellt oder gebilligt werden, und stellen diese nicht dar. Lesen Sie mehr in den Nutzungsbedingungen.
Creator of DepthHouse Indicators on TradingView!
↣ depthhouse.com/
↣ depthhouse.com/
Haftungsausschluss
Die Informationen und Veröffentlichungen sind nicht als Finanz-, Anlage-, Handels- oder andere Arten von Ratschlägen oder Empfehlungen gedacht, die von TradingView bereitgestellt oder gebilligt werden, und stellen diese nicht dar. Lesen Sie mehr in den Nutzungsbedingungen.