
Text me if you have any questions/comments for me.
-----
XRF
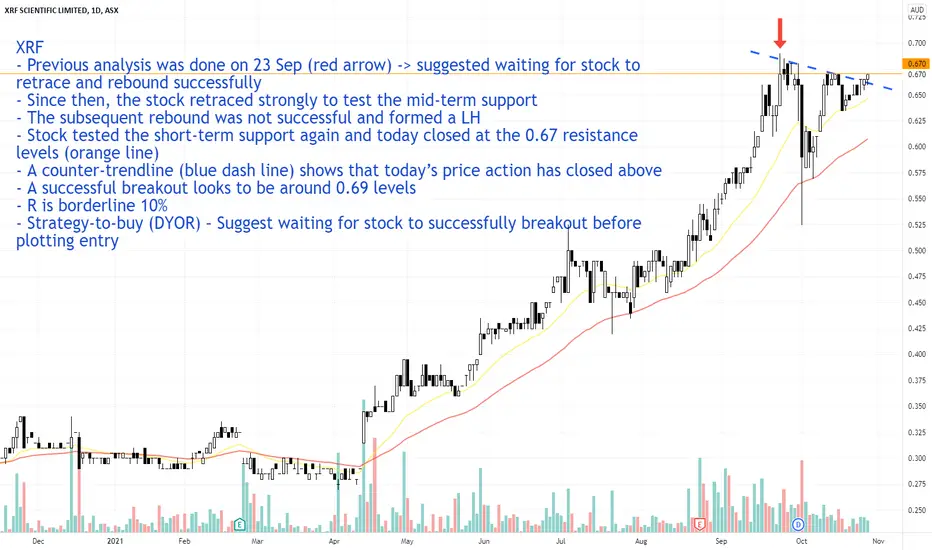
- Previous analysis was done on 23 Sep (red arrow) -> suggested waiting for stock to retrace and rebound successfully
- Since then, the stock retraced strongly to test the mid-term support
- The subsequent rebound was not successful and formed a LH
- Stock tested the short-term support again and today closed at the 0.67 resistance levels (orange line)
- A counter-trendline (blue dash line) shows that today’s price action has closed above
- A successful breakout looks to be around 0.69 levels
- R is borderline 10%
- Strategy-to-buy (DYOR) – Suggest waiting for stock to successfully breakout before plotting entry

Haftungsausschluss
Die Informationen und Veröffentlichungen sind nicht als Finanz-, Anlage-, Handels- oder andere Arten von Ratschlägen oder Empfehlungen gedacht, die von TradingView bereitgestellt oder gebilligt werden, und stellen diese nicht dar. Lesen Sie mehr in den Nutzungsbedingungen.
Haftungsausschluss
Die Informationen und Veröffentlichungen sind nicht als Finanz-, Anlage-, Handels- oder andere Arten von Ratschlägen oder Empfehlungen gedacht, die von TradingView bereitgestellt oder gebilligt werden, und stellen diese nicht dar. Lesen Sie mehr in den Nutzungsbedingungen.