
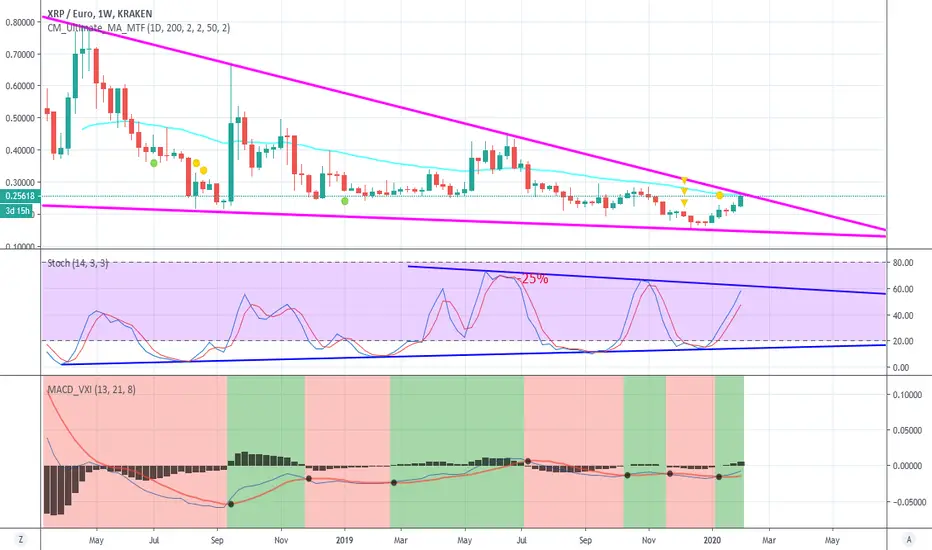
On short term, I do not see XRP long on my chart.
Maybe it's because I use Kraken based chart but I see we are still under the big resistance of the pink triangle.
And all the Stochastic / RSI are overbought in all chart. Only 1W chart is ok with these indicators, but 1W chart is for long term trade...
I see hundred of charts only based with horizontal lines, no indicators, no trend lines and can tell this is long, we are going to the next resistance. I don't really get it.
Maybe it's because I use Kraken based chart but I see we are still under the big resistance of the pink triangle.
And all the Stochastic / RSI are overbought in all chart. Only 1W chart is ok with these indicators, but 1W chart is for long term trade...
I see hundred of charts only based with horizontal lines, no indicators, no trend lines and can tell this is long, we are going to the next resistance. I don't really get it.

Haftungsausschluss
Die Informationen und Veröffentlichungen sind nicht als Finanz-, Anlage-, Handels- oder andere Arten von Ratschlägen oder Empfehlungen gedacht, die von TradingView bereitgestellt oder gebilligt werden, und stellen diese nicht dar. Lesen Sie mehr in den Nutzungsbedingungen.
Haftungsausschluss
Die Informationen und Veröffentlichungen sind nicht als Finanz-, Anlage-, Handels- oder andere Arten von Ratschlägen oder Empfehlungen gedacht, die von TradingView bereitgestellt oder gebilligt werden, und stellen diese nicht dar. Lesen Sie mehr in den Nutzungsbedingungen.