
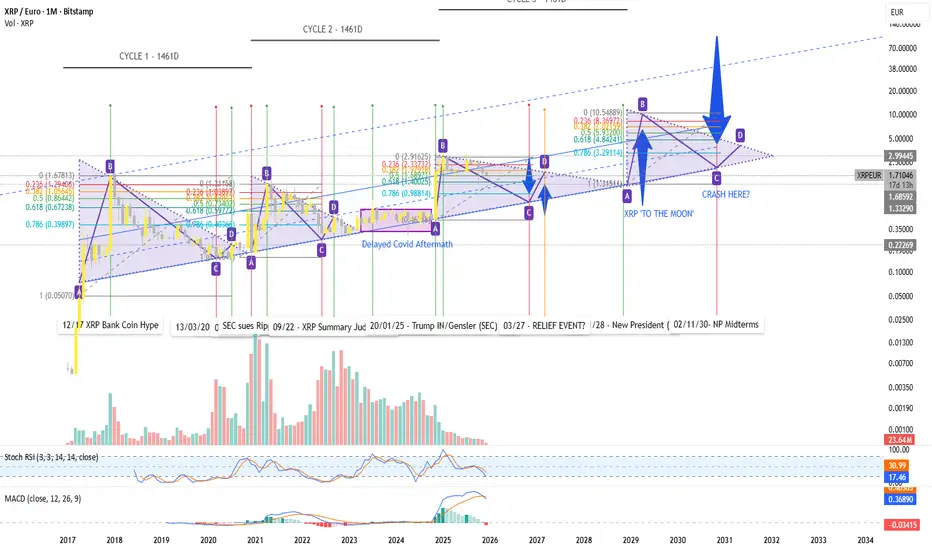
The chart maps XRP from 2017 to 2030 on a monthly timeframe.
Key external events (legal, macroeconomic, political) are explicitly marked.
Green vertical lines indicate cyclical tops, while red vertical lines indicate cyclical bottoms.
Price action develops within a clearly defined long-term ascending channel, which has been respected across multiple cycles.
Each cycle unfolds through a triangle consolidation pattern, followed by an impulse move and a corrective phase.
Fibonacci retracements are included to visualize the relationship between impulsive and corrective moves; prior corrections repeatedly align with the 0.618–0.786 levels.
The time cycles of 1,461 days (4 years) remain consistent throughout the chart, indicating a stable cyclical rhythm.
Based on time structure and pattern repetition, a cyclical endpoint is projected around 2029–2030, coinciding with a broader macroeconomic reset period.
Key external events (legal, macroeconomic, political) are explicitly marked.
Green vertical lines indicate cyclical tops, while red vertical lines indicate cyclical bottoms.
Price action develops within a clearly defined long-term ascending channel, which has been respected across multiple cycles.
Each cycle unfolds through a triangle consolidation pattern, followed by an impulse move and a corrective phase.
Fibonacci retracements are included to visualize the relationship between impulsive and corrective moves; prior corrections repeatedly align with the 0.618–0.786 levels.
The time cycles of 1,461 days (4 years) remain consistent throughout the chart, indicating a stable cyclical rhythm.
Based on time structure and pattern repetition, a cyclical endpoint is projected around 2029–2030, coinciding with a broader macroeconomic reset period.

Haftungsausschluss
Die Informationen und Veröffentlichungen sind nicht als Finanz-, Anlage-, Handels- oder andere Arten von Ratschlägen oder Empfehlungen gedacht, die von TradingView bereitgestellt oder gebilligt werden, und stellen diese nicht dar. Lesen Sie mehr in den Nutzungsbedingungen.
Haftungsausschluss
Die Informationen und Veröffentlichungen sind nicht als Finanz-, Anlage-, Handels- oder andere Arten von Ratschlägen oder Empfehlungen gedacht, die von TradingView bereitgestellt oder gebilligt werden, und stellen diese nicht dar. Lesen Sie mehr in den Nutzungsbedingungen.