
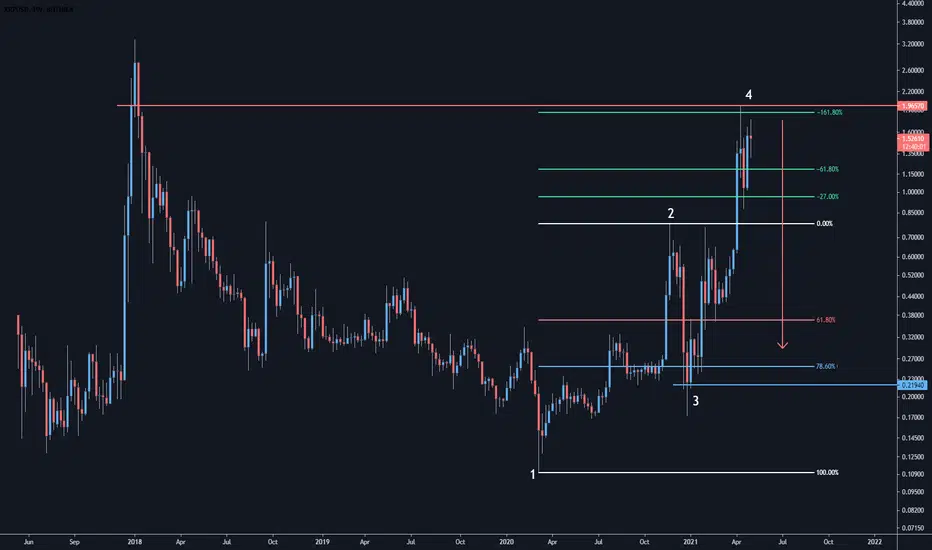
Following the previous post of the Monthly Timeframe, this Weekly Fibonacci further validates why $1.96 is a rejection zone.
The -161.8% Extension aligns with the Dec 2017 / Jan 2018 candle closes where we have tapped it perfectly.
I would anticipate that the next move would be back towards 61.8% and 78.6% retracements where we can identify the next set up.
I will post a Daily Timeframe analysis of this bias to complete the full top-down analysis which shows more confirmations.
The -161.8% Extension aligns with the Dec 2017 / Jan 2018 candle closes where we have tapped it perfectly.
I would anticipate that the next move would be back towards 61.8% and 78.6% retracements where we can identify the next set up.
I will post a Daily Timeframe analysis of this bias to complete the full top-down analysis which shows more confirmations.
Anmerkung
Monthly Analysis - 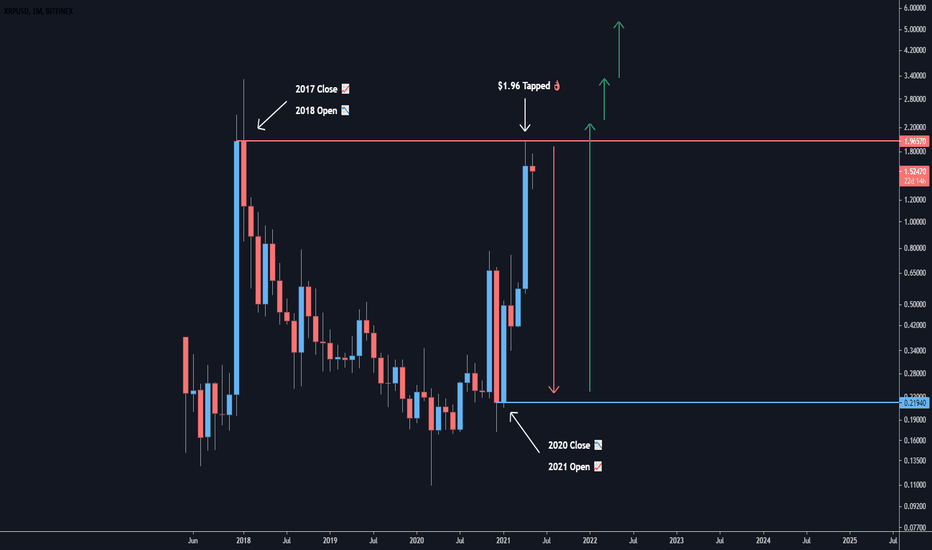
Anmerkung
Daily Analysis - 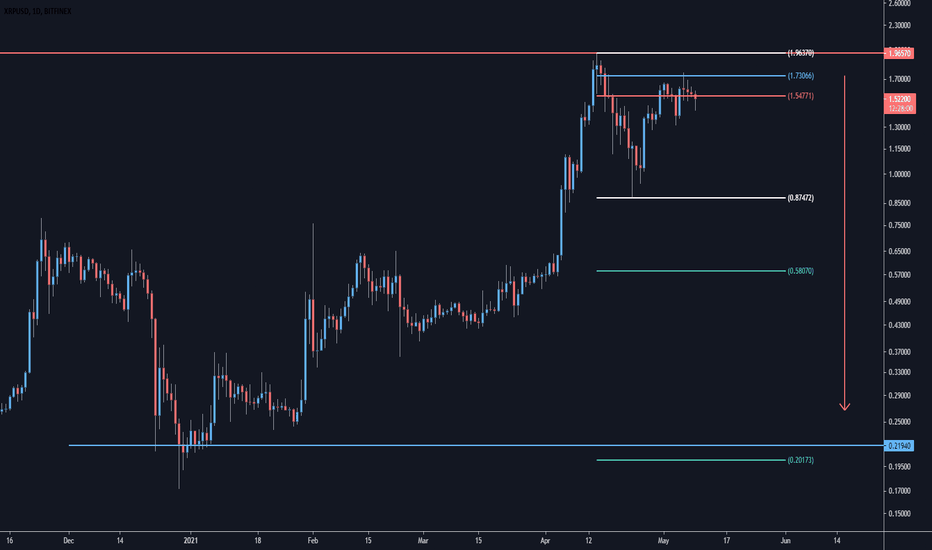

Haftungsausschluss
Die Informationen und Veröffentlichungen sind nicht als Finanz-, Anlage-, Handels- oder andere Arten von Ratschlägen oder Empfehlungen gedacht, die von TradingView bereitgestellt oder gebilligt werden, und stellen diese nicht dar. Lesen Sie mehr in den Nutzungsbedingungen.
Haftungsausschluss
Die Informationen und Veröffentlichungen sind nicht als Finanz-, Anlage-, Handels- oder andere Arten von Ratschlägen oder Empfehlungen gedacht, die von TradingView bereitgestellt oder gebilligt werden, und stellen diese nicht dar. Lesen Sie mehr in den Nutzungsbedingungen.