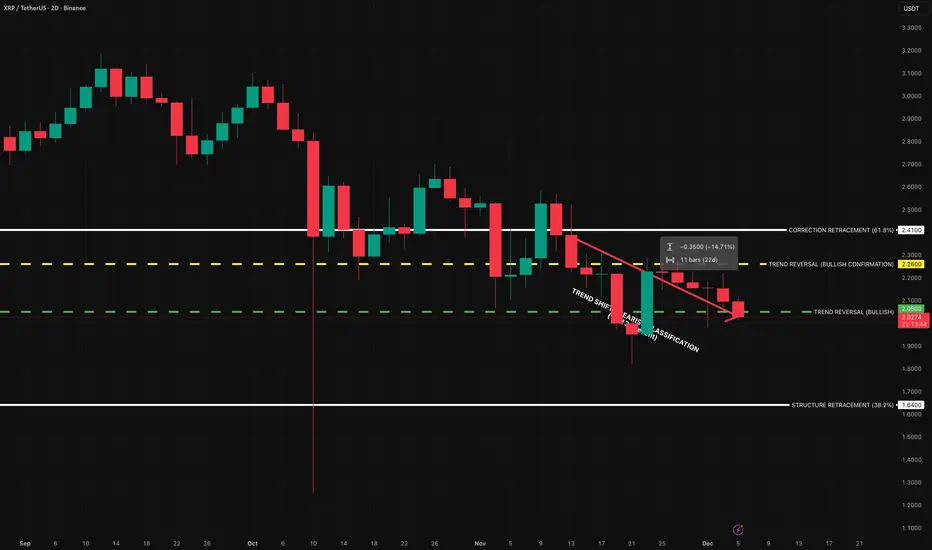
XRP — [2D] WEEK 49 TREND REPORT | 12/05/2025
Ticker:
 XRPUSDT
Timeframe: 2D
This is a reactive structural classification of XRP based on the weekly chart as of this timestamp. Price conditions are evaluated as they stand — nothing here is predictive or forward-assumptive.
⸻
1) Current Trend Condition [Numbers to Watch]
Current Price @ 2.03
• Trend Duration @ +22 Days (Bullish) [-14.71%]
• Trend Reversal Level (Bullish) @ 2.05
• Trend Reversal Level (Bullish Confirmation) @ 2.26
• Correction Retracement @ 2.41
• Structural Support @ 1.64
⸻
2) Structure Health
• Retracement Phase:
Testing Structure (approaching 38.2%)
• Position Status:
Unstable (price below both structural layers)
⸻
3) Temperature:
Cooling Phase
⸻
4) Momentum:
Bearish
⸻
Author’s Note
DOWNWARD STRUCTURAL ALIGNMENT
This mark identifies a moment where the market showed clearer alignment with downside direction. It does not predict future movement, but acknowledges where weakness became more evident within the prevailing structure. Its relevance remains only while price continues to hold beneath key structural boundaries.
⸻
Methodology Overview
This classification framework evaluates directional conditions using internal trend-interpretation logic that references price behavior relative to its structural layers. These relationships are used to identify when price movement aligns with the framework’s criteria for directional phases, transition points, or regime shifts. Visual elements or structural labels reflect these internal interpretations, rather than explicit trading signals or preset indicator crossovers. This framework is observational only and does not imply future outcomes.
Ticker:
XRPUSDT Timeframe: 2D
This is a reactive structural classification of XRP based on the weekly chart as of this timestamp. Price conditions are evaluated as they stand — nothing here is predictive or forward-assumptive.
⸻
1) Current Trend Condition [Numbers to Watch]
Current Price @ 2.03
• Trend Duration @ +22 Days (Bullish) [-14.71%]
• Trend Reversal Level (Bullish) @ 2.05
• Trend Reversal Level (Bullish Confirmation) @ 2.26
• Correction Retracement @ 2.41
• Structural Support @ 1.64
⸻
2) Structure Health
• Retracement Phase:
Testing Structure (approaching 38.2%)
• Position Status:
Unstable (price below both structural layers)
⸻
3) Temperature:
Cooling Phase
⸻
4) Momentum:
Bearish
⸻
Author’s Note
DOWNWARD STRUCTURAL ALIGNMENT
This mark identifies a moment where the market showed clearer alignment with downside direction. It does not predict future movement, but acknowledges where weakness became more evident within the prevailing structure. Its relevance remains only while price continues to hold beneath key structural boundaries.
⸻
Methodology Overview
This classification framework evaluates directional conditions using internal trend-interpretation logic that references price behavior relative to its structural layers. These relationships are used to identify when price movement aligns with the framework’s criteria for directional phases, transition points, or regime shifts. Visual elements or structural labels reflect these internal interpretations, rather than explicit trading signals or preset indicator crossovers. This framework is observational only and does not imply future outcomes.

Tracking 15 names across SPX, NDX, and DJX leadership with structured weekly market reads and public scorekeeping. For deeper updates, chart posts, and progress tracking, follow my Instagram: @GURULifelineHQ.
Verbundene Veröffentlichungen
Haftungsausschluss
Die Informationen und Veröffentlichungen sind nicht als Finanz-, Anlage-, Handels- oder andere Arten von Ratschlägen oder Empfehlungen gedacht, die von TradingView bereitgestellt oder gebilligt werden, und stellen diese nicht dar. Lesen Sie mehr in den Nutzungsbedingungen.
Tracking 15 names across SPX, NDX, and DJX leadership with structured weekly market reads and public scorekeeping. For deeper updates, chart posts, and progress tracking, follow my Instagram: @GURULifelineHQ.
Verbundene Veröffentlichungen
Haftungsausschluss
Die Informationen und Veröffentlichungen sind nicht als Finanz-, Anlage-, Handels- oder andere Arten von Ratschlägen oder Empfehlungen gedacht, die von TradingView bereitgestellt oder gebilligt werden, und stellen diese nicht dar. Lesen Sie mehr in den Nutzungsbedingungen.