
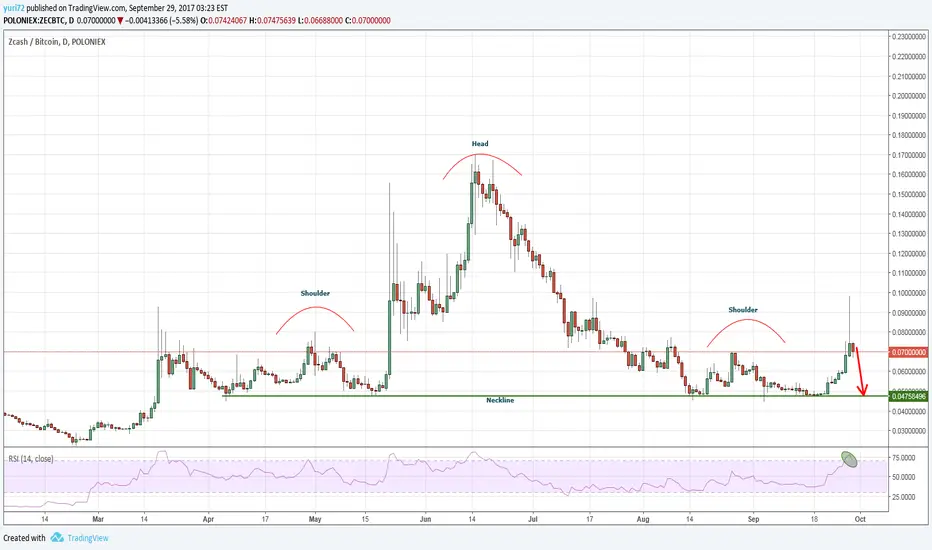
This graph just struck my eye!
thought where have I seen this before: a shoulder-head-shoulder on the (fairly recent) daily candles that did not result in a sell off but instead a new bounce of the neckline.
Answer:
- this graph: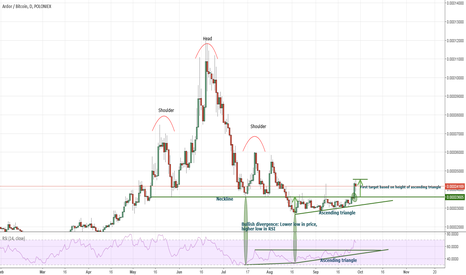
- but also this one: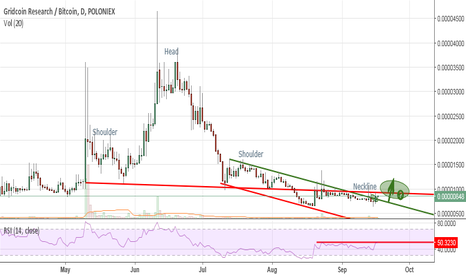
- or this one: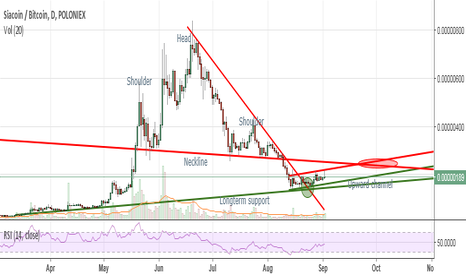
And there are many more examples to be found (another is for instance NXT/BTC).
All these graphs have something in commen: after the rightshoulder finishes there is no break of the neckline, but a new bounce (some have big bounces others smaller ones), and after that bounce the neckline is revisted and often broken as well.. not for a massive sell off but still for som further drops..
Seeing all these graphs I would say Zcash is also heading back to the neckline (0.047 area).
RSI looks strong on this coin (overbought on the daily, so allso reason for some cooling off), so in this case the neckline might/should hold.
Just my 2 cents ;)
if you liked please agree. Thank you all!!
thought where have I seen this before: a shoulder-head-shoulder on the (fairly recent) daily candles that did not result in a sell off but instead a new bounce of the neckline.
Answer:
- this graph:
- but also this one:
- or this one:
And there are many more examples to be found (another is for instance NXT/BTC).
All these graphs have something in commen: after the rightshoulder finishes there is no break of the neckline, but a new bounce (some have big bounces others smaller ones), and after that bounce the neckline is revisted and often broken as well.. not for a massive sell off but still for som further drops..
Seeing all these graphs I would say Zcash is also heading back to the neckline (0.047 area).
RSI looks strong on this coin (overbought on the daily, so allso reason for some cooling off), so in this case the neckline might/should hold.
Just my 2 cents ;)
if you liked please agree. Thank you all!!
Anmerkung
I would say: sofar not a bad idea, between all the Zcash 'long shoutouts' @ tradingview :)Trade geschlossen: Ziel wurde erreicht
There we are right @ the neckline.. of course current sentiment helped.. but even before we were allready on our way
Haftungsausschluss
Die Informationen und Veröffentlichungen sind nicht als Finanz-, Anlage-, Handels- oder andere Arten von Ratschlägen oder Empfehlungen gedacht, die von TradingView bereitgestellt oder gebilligt werden, und stellen diese nicht dar. Lesen Sie mehr in den Nutzungsbedingungen.
Haftungsausschluss
Die Informationen und Veröffentlichungen sind nicht als Finanz-, Anlage-, Handels- oder andere Arten von Ratschlägen oder Empfehlungen gedacht, die von TradingView bereitgestellt oder gebilligt werden, und stellen diese nicht dar. Lesen Sie mehr in den Nutzungsbedingungen.