
📌 Quick Market Specs
Stock: ZEOT (Extracted Oils & Derivatives)
Market: EGX (Egypt)
Timeframe: Daily (1D)
Current Price: 8.81 EGP (-1.34%)
🔍 Comprehensive Technical Breakdown
1. Macro Structure: The Broadening/Symmetrical Wedge
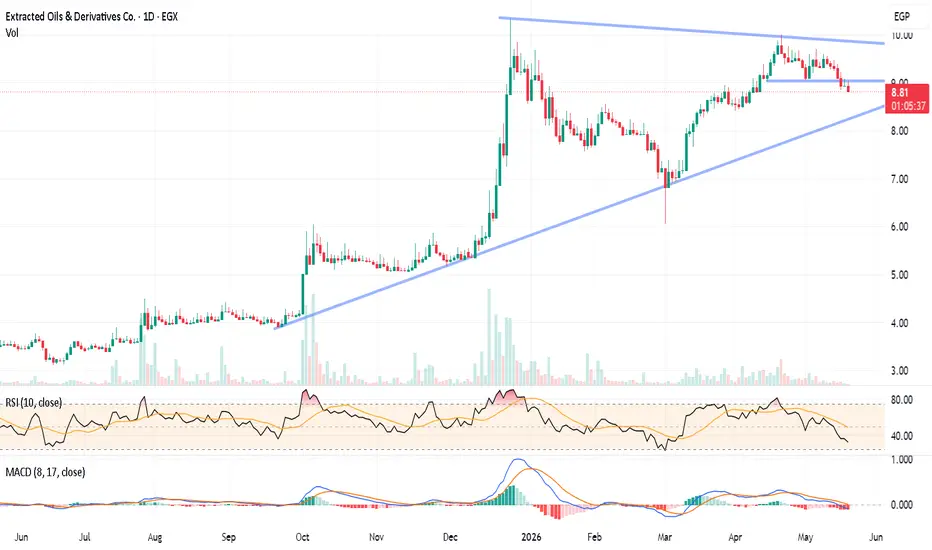
On a daily structural basis, ZEOT is trading inside a large, multi-month consolidation pattern bounded by a primary ascending support trendline (originating from late 2025) and a slightly descending upper resistance ceiling capping price action near the 10.00 EGP psychological mark.
2. Current Price Action & Support Breach
Minor Support Failure: The price has recently slipped below a minor horizontal support shelf at 9.00 EGP (marked by the short blue horizontal line).
The Target Target Zone: This minor breakdown is driving the price toward a much stronger, high-consequence confluence zone: the macro ascending trendline currently rising through the 8.40 – 8.50 EGP region.
3. Volume and Liquidity Characteristics
A key bullish characteristic of this entire corrective phase from mid-April to present is the significantly diminishing volume profile.
The thin volume bars accompanying the slide from 9.80 EGP down to 8.81 EGP indicate a distinct lack of aggressive institutional distribution. Instead, this represents a low-liquidity drift down toward structural demand pockets.
4. Momentum Indicators & Oscillators
RSI (10, close): The relative strength index has dropped into bearish territory at 32.60. It is quickly approaching the oversold threshold (30). Historically on this chart, when the RSI approaches 30 as the price hits the lower trendline (e.g., early March 2026), it acts as a highly reliable precursor to a sharp, impulsive bounce.
MACD (8, 17, close): The MACD line has crossed below its signal line and crossed into slightly negative territory (-0.099). While the short-term momentum is clearly bearish, the histogram is beginning to flatten out, suggesting that the velocity of the downside movement may soon hit exhaustion.
🛡️ Strategic Trading Setup & Execution Levels
Because the price is trading between a broken minor support and a major macro trendline, tactical patience is required to wait for a confirmed structural floor before entering long positions.
📥 The Long Entry Setup
Accumulation/Watch Zone: 8.40 – 8.60 EGP. This area marks the precise intersection of the long-term ascending trendline and oversold oscillator conditions.
Confirmation Trigger: Look for a daily reversal candle pattern (e.g., a long-wick hammer, doji, or a strong bullish engulfing) accompanied by an expansion in buying volume to confirm the floor is set.
🛑 Risk Management (Stop Loss)
Stop Loss (SL): A decisive daily close below 8.20 EGP. Falling below this level would officially break the macro ascending trendline, invalidating the multi-month bullish structure and opening the door for a deeper correction toward 7.00 EGP.
🎯 Profit Targets (Take Profit)
Take Profit 1 (TP1): 9.00 EGP (The previous horizontal shelf, which will now act as immediate structural resistance).
Take Profit 2 (TP2): 9.60 – 9.80 EGP (The recent local swing highs).
Take Profit 3 (TP3): 10.00 EGP (The macro descending upper boundary resistance).
Stock: ZEOT (Extracted Oils & Derivatives)
Market: EGX (Egypt)
Timeframe: Daily (1D)
Current Price: 8.81 EGP (-1.34%)
🔍 Comprehensive Technical Breakdown
1. Macro Structure: The Broadening/Symmetrical Wedge
On a daily structural basis, ZEOT is trading inside a large, multi-month consolidation pattern bounded by a primary ascending support trendline (originating from late 2025) and a slightly descending upper resistance ceiling capping price action near the 10.00 EGP psychological mark.
2. Current Price Action & Support Breach
Minor Support Failure: The price has recently slipped below a minor horizontal support shelf at 9.00 EGP (marked by the short blue horizontal line).
The Target Target Zone: This minor breakdown is driving the price toward a much stronger, high-consequence confluence zone: the macro ascending trendline currently rising through the 8.40 – 8.50 EGP region.
3. Volume and Liquidity Characteristics
A key bullish characteristic of this entire corrective phase from mid-April to present is the significantly diminishing volume profile.
The thin volume bars accompanying the slide from 9.80 EGP down to 8.81 EGP indicate a distinct lack of aggressive institutional distribution. Instead, this represents a low-liquidity drift down toward structural demand pockets.
4. Momentum Indicators & Oscillators
RSI (10, close): The relative strength index has dropped into bearish territory at 32.60. It is quickly approaching the oversold threshold (30). Historically on this chart, when the RSI approaches 30 as the price hits the lower trendline (e.g., early March 2026), it acts as a highly reliable precursor to a sharp, impulsive bounce.
MACD (8, 17, close): The MACD line has crossed below its signal line and crossed into slightly negative territory (-0.099). While the short-term momentum is clearly bearish, the histogram is beginning to flatten out, suggesting that the velocity of the downside movement may soon hit exhaustion.
🛡️ Strategic Trading Setup & Execution Levels
Because the price is trading between a broken minor support and a major macro trendline, tactical patience is required to wait for a confirmed structural floor before entering long positions.
📥 The Long Entry Setup
Accumulation/Watch Zone: 8.40 – 8.60 EGP. This area marks the precise intersection of the long-term ascending trendline and oversold oscillator conditions.
Confirmation Trigger: Look for a daily reversal candle pattern (e.g., a long-wick hammer, doji, or a strong bullish engulfing) accompanied by an expansion in buying volume to confirm the floor is set.
🛑 Risk Management (Stop Loss)
Stop Loss (SL): A decisive daily close below 8.20 EGP. Falling below this level would officially break the macro ascending trendline, invalidating the multi-month bullish structure and opening the door for a deeper correction toward 7.00 EGP.
🎯 Profit Targets (Take Profit)
Take Profit 1 (TP1): 9.00 EGP (The previous horizontal shelf, which will now act as immediate structural resistance).
Take Profit 2 (TP2): 9.60 – 9.80 EGP (The recent local swing highs).
Take Profit 3 (TP3): 10.00 EGP (The macro descending upper boundary resistance).

Haftungsausschluss
Die Informationen und Veröffentlichungen sind nicht als Finanz-, Anlage-, Handels- oder andere Arten von Ratschlägen oder Empfehlungen gedacht, die von TradingView bereitgestellt oder gebilligt werden, und stellen diese nicht dar. Lesen Sie mehr in den Nutzungsbedingungen.
Haftungsausschluss
Die Informationen und Veröffentlichungen sind nicht als Finanz-, Anlage-, Handels- oder andere Arten von Ratschlägen oder Empfehlungen gedacht, die von TradingView bereitgestellt oder gebilligt werden, und stellen diese nicht dar. Lesen Sie mehr in den Nutzungsbedingungen.