
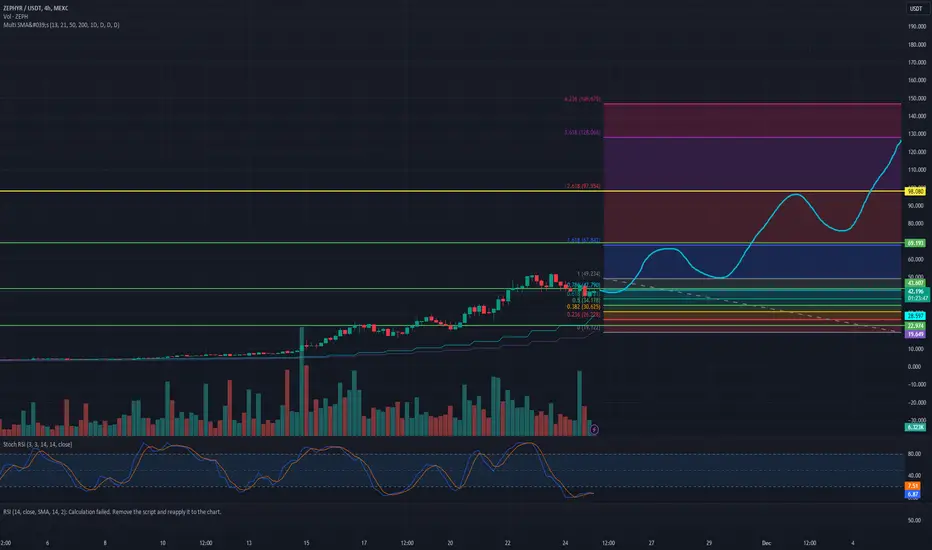
So the hidden bearish divergence is playing out exactly as we guess judging off 12h RSI.
However volume in OBs around $34 provide enough cushion to see a leap to the next Elliot wave of $67, with two taps the third tap can lead to a swing failure pattern break through upwards of $98
However volume in OBs around $34 provide enough cushion to see a leap to the next Elliot wave of $67, with two taps the third tap can lead to a swing failure pattern break through upwards of $98

Haftungsausschluss
Die Informationen und Veröffentlichungen sind nicht als Finanz-, Anlage-, Handels- oder andere Arten von Ratschlägen oder Empfehlungen gedacht, die von TradingView bereitgestellt oder gebilligt werden, und stellen diese nicht dar. Lesen Sie mehr in den Nutzungsbedingungen.
Haftungsausschluss
Die Informationen und Veröffentlichungen sind nicht als Finanz-, Anlage-, Handels- oder andere Arten von Ratschlägen oder Empfehlungen gedacht, die von TradingView bereitgestellt oder gebilligt werden, und stellen diese nicht dar. Lesen Sie mehr in den Nutzungsbedingungen.