
DXY & REAL YIELD IMPLICATIONS
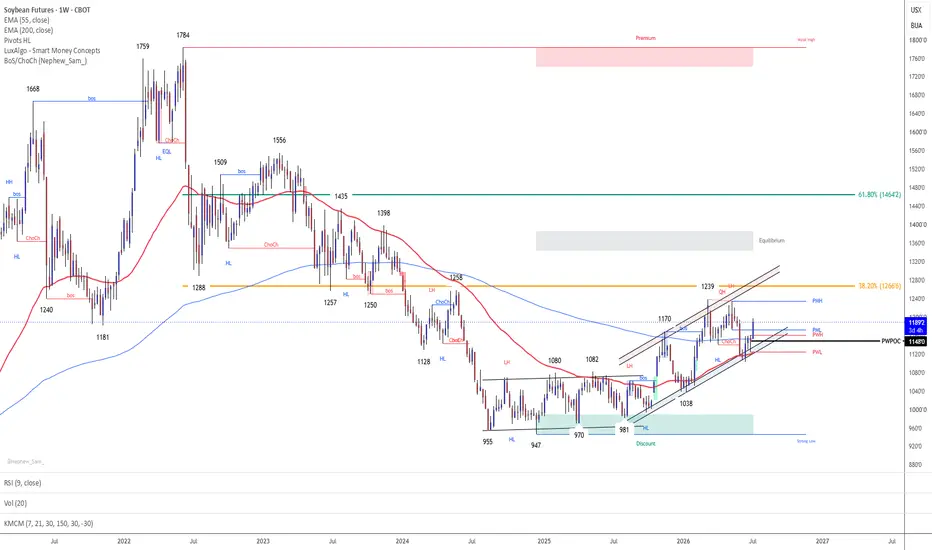
DXY 100.90, real yield 2.255% — both still restrictive for the broader commodity complex (BCOM 125.72). Hawkish Warsh Fed is a structural headwind, but soybean's demand-side story (crush/biodiesel) is currently strong enough to decouple from the DXY-driven bearish macro pressuring metals — similar decoupling dynamic to the wheat fertilizer/Iran narrative flagged earlier this week. LIQUIDITY MAP : Price (1187.4) is trading above the prior weekly high and just below the prior monthly high (1194.4) — resting inside a resistance shelf. Above, the poor high cluster at 1200.6/1212.0/1220.0 represents unfinished business — thin, low-volume territory that acts as a magnet once 1194.4 is cleared. Below, single prints at 1184.6/1174.2/1164.4 are the first layer of untested support on any retracement, backstopped by weekly 200 EMA (1152.4), prior weekly POC (1148), and the poor low at 1146. WYCKOFF / MARKET PROFILE
Structure resembles a markup phase testing into a supply zone, with the single prints beneath (1164.4/1174.2/1184.6) representing unfinished auction — a "b" distribution shape isn't yet confirmed since price hasn't rejected the highs. Given 4H KMCM is FOMO/Overheated while Daily KMCM is Neutral/Balanced, the more probable near-term sequence is a local Upthrust-style test of the poor highs (1200.6+) followed by rotation back toward the weekly POC (1148) or single-print support, rather than clean acceptance and a full Sign-of-Strength extension — unless WASDE (Jul 10) supplies a genuine fundamental trigger. TRADE LOCATION & INVALIDATION
Continuation long (pullback entry): 1174.2–1164.4 single-print zone | Invalidation: close below 1152.4 (weekly 200 EMA) / 1148 (prior weekly POC)
Breakout long (momentum entry): acceptance above 1194.4 Target 1200.6 → 1212.0 → 1220.0 Invalidation: re-entry below 1184.6
Fade short (mean-reversion, 4H overheated): 1200.6–1212.0 Target 1148 (weekly POC) Invalidation: close above 1220.0
DXY 100.90, real yield 2.255% — both still restrictive for the broader commodity complex (BCOM 125.72). Hawkish Warsh Fed is a structural headwind, but soybean's demand-side story (crush/biodiesel) is currently strong enough to decouple from the DXY-driven bearish macro pressuring metals — similar decoupling dynamic to the wheat fertilizer/Iran narrative flagged earlier this week. LIQUIDITY MAP : Price (1187.4) is trading above the prior weekly high and just below the prior monthly high (1194.4) — resting inside a resistance shelf. Above, the poor high cluster at 1200.6/1212.0/1220.0 represents unfinished business — thin, low-volume territory that acts as a magnet once 1194.4 is cleared. Below, single prints at 1184.6/1174.2/1164.4 are the first layer of untested support on any retracement, backstopped by weekly 200 EMA (1152.4), prior weekly POC (1148), and the poor low at 1146. WYCKOFF / MARKET PROFILE
Structure resembles a markup phase testing into a supply zone, with the single prints beneath (1164.4/1174.2/1184.6) representing unfinished auction — a "b" distribution shape isn't yet confirmed since price hasn't rejected the highs. Given 4H KMCM is FOMO/Overheated while Daily KMCM is Neutral/Balanced, the more probable near-term sequence is a local Upthrust-style test of the poor highs (1200.6+) followed by rotation back toward the weekly POC (1148) or single-print support, rather than clean acceptance and a full Sign-of-Strength extension — unless WASDE (Jul 10) supplies a genuine fundamental trigger. TRADE LOCATION & INVALIDATION
Continuation long (pullback entry): 1174.2–1164.4 single-print zone | Invalidation: close below 1152.4 (weekly 200 EMA) / 1148 (prior weekly POC)
Breakout long (momentum entry): acceptance above 1194.4 Target 1200.6 → 1212.0 → 1220.0 Invalidation: re-entry below 1184.6
Fade short (mean-reversion, 4H overheated): 1200.6–1212.0 Target 1148 (weekly POC) Invalidation: close above 1220.0

Haftungsausschluss
Die Informationen und Veröffentlichungen sind nicht als Finanz-, Anlage-, Handels- oder andere Arten von Ratschlägen oder Empfehlungen gedacht, die von TradingView bereitgestellt oder gebilligt werden, und stellen diese nicht dar. Lesen Sie mehr in den Nutzungsbedingungen.
Haftungsausschluss
Die Informationen und Veröffentlichungen sind nicht als Finanz-, Anlage-, Handels- oder andere Arten von Ratschlägen oder Empfehlungen gedacht, die von TradingView bereitgestellt oder gebilligt werden, und stellen diese nicht dar. Lesen Sie mehr in den Nutzungsbedingungen.