
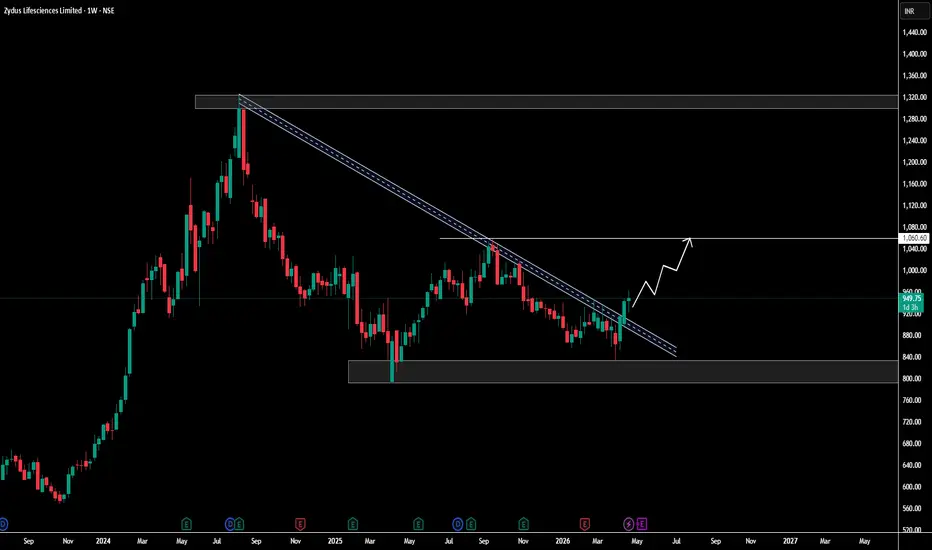
Zydus Lifesciences appears to be trading near a long-term falling trendline breakout zone on the weekly timeframe. Price is attempting to move above the descending channel, which can indicate a potential trend reversal if sustained.
Key Levels:
Immediate Resistance: ₹1,050 – ₹1,060
Major Resistance Zone: ₹1,280 – ₹1,320
Support Zone: ₹800 – ₹840
Current Price Area: Around ₹947
Bullish View:
If the stock sustains above ₹950 and gives a strong weekly close above ₹1,060, momentum may build towards ₹1,150+ first, then possibly the ₹1,280 zone in coming months.
Bearish View:
If price fails to hold the breakout and slips below ₹900, it may retest the strong support zone near ₹840 / ₹800.
Trading Approach:
Aggressive traders: Watch breakout above ₹1,060 with volume confirmation.
Conservative traders: Wait for pullback and hold near support before entry.
Overall View:
Chart structure is improving, but confirmation above resistance is still needed. Until then, stock may remain range-bound.
Disclaimer: This is only technical analysis for educational purposes, not a buy/sell recommendation. Please do your own research before investing.
Key Levels:
Immediate Resistance: ₹1,050 – ₹1,060
Major Resistance Zone: ₹1,280 – ₹1,320
Support Zone: ₹800 – ₹840
Current Price Area: Around ₹947
Bullish View:
If the stock sustains above ₹950 and gives a strong weekly close above ₹1,060, momentum may build towards ₹1,150+ first, then possibly the ₹1,280 zone in coming months.
Bearish View:
If price fails to hold the breakout and slips below ₹900, it may retest the strong support zone near ₹840 / ₹800.
Trading Approach:
Aggressive traders: Watch breakout above ₹1,060 with volume confirmation.
Conservative traders: Wait for pullback and hold near support before entry.
Overall View:
Chart structure is improving, but confirmation above resistance is still needed. Until then, stock may remain range-bound.
Disclaimer: This is only technical analysis for educational purposes, not a buy/sell recommendation. Please do your own research before investing.

Haftungsausschluss
Die Informationen und Veröffentlichungen sind nicht als Finanz-, Anlage-, Handels- oder andere Arten von Ratschlägen oder Empfehlungen gedacht, die von TradingView bereitgestellt oder gebilligt werden, und stellen diese nicht dar. Lesen Sie mehr in den Nutzungsbedingungen.
Haftungsausschluss
Die Informationen und Veröffentlichungen sind nicht als Finanz-, Anlage-, Handels- oder andere Arten von Ratschlägen oder Empfehlungen gedacht, die von TradingView bereitgestellt oder gebilligt werden, und stellen diese nicht dar. Lesen Sie mehr in den Nutzungsbedingungen.