U S O I L : ($69.07 Buy Limit)For today we will be having a (Buy Limit Trade) for (Oil) at the price of ($69.07) this is because when we look at our (Long Term Trend Direction) we can see that we have been in a very (Bearish Trend) and shows clearly that it's a (Downtrend) so it would be wise to wait patiently for the (Price) to drop even (Lower) before considering any (Buying) as this can lead to a (Buy Trap) and cause a (Loss) because the price will continue (Decreasing)
The (Low) for the day is ($73.40) and the (High) b
Ascending Channel
XNGUSD: Can buyers defend the 2.80 zone?🎯 Trade Setup:
Direction: Long from support confirmation
🔺 Entry: $2.805-$2.812
🛑 Stop Loss: $2.785
🎯 Take Profit 1: $2.820
🎯 Take Profit 2: $2.834
📰 News:
The fundamental backdrop is mixed. The latest EIA storage report showed a larger-than-expected build, which is bearish because it signals that supply is still comfortable. High production also limits upside.
But the downside is not clean either. Hot weather keeps power-sector demand elevated, and LNG export flows continue to support consump
U S O I L : ($88.90 Buy Stop)For this (Trade Setup) today on (Oil) we will be buying as this is because we are simply respecting the (Long Term Trend Direction) together with the (Market Price Bias) we can see that we've been having a nice (Uptrend) and that (Bulls) have clearly had control over the past few days (Overpowering) the (Bears)
The reasoning for the (Buy Stop) at ($88.90) is because we are simple seeing some (Upside Direction Potential) as we could return back into the (Upside Direction) of (Highs) from the (D
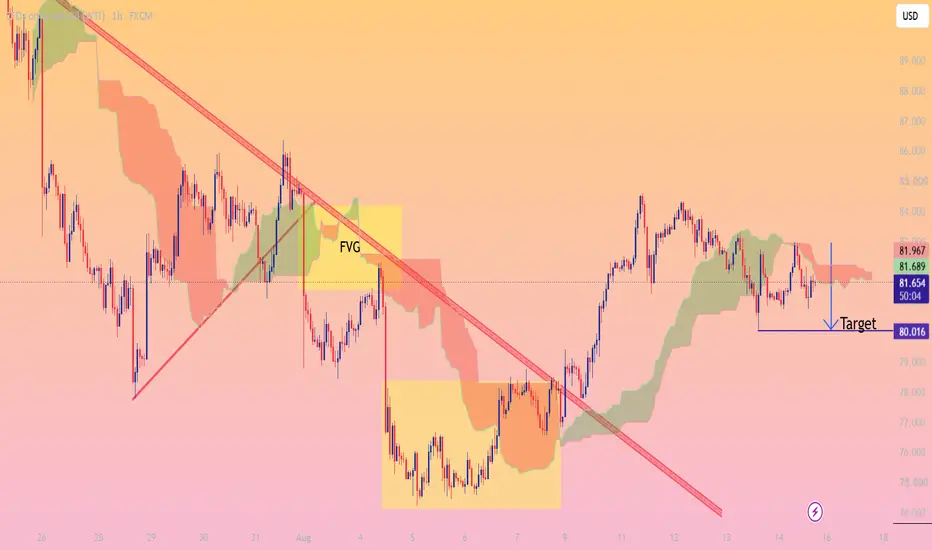
USOIL Bearish Breakdown — Target 80.02
USOIL is showing a bearish setup on the 1-hour chart, with price struggling below the 81.70–82.00 resistance zone. The recent rejection and weakening price structure suggest sellers may regain control.
A break below the nearby support could open the way toward the marked downside target.
🎯 Target: 80.02
Natural Gas: real breakdown or stop hunt?Natural Gas: real breakdown or stop hunt?
Natural gas is trading near $2.76, testing the key support zone at $2.74–$2.76. This area is important because price is sitting close to the SMA 200 near $2.756, while sellers have already pushed gas below the short-term structure.
Seven of Futures warns about false signals and hidden risk. In market language, this card points to a possible fake breakdown, stop hunt, or trap move before the real direction becomes clear. It asks traders not to chase th
WTI CRUDE OIL: New bearish wave to $71.50 started.WTI Crude Oil turned neutral again on its 1D technical outlook (RSI = 52.585, MACD = 0.700, ADX = 21.051) the August rally got rejected and reversed on the Channel Down top. A crossing under the 1D MA50, would accelerate the new bearish wave to test the 1W MA100 again (TP = 71.50) quite possibly before August is over.
## If you like our free content follow our profile to get more daily ideas. ##
## Comments and likes are greatly appreciated. ##
WTI short term levels to watch as crude consolidates With the weekend approaching, US oi was holding steady around the $80 level. Crude fell yesterday but but the broader supply risk has not gone away. With no meaningful progress towards reviving the previous US-Iran agreement, the risks remain tilted to the upside for oil prices. Comments from US Treasury Secretary Scott Bessent, who said Washington would pursue unprecedented measures against Iran as part of its maximum-pressure campaign, add to the uncertainty.
WTI 2 hour chart shows prices co
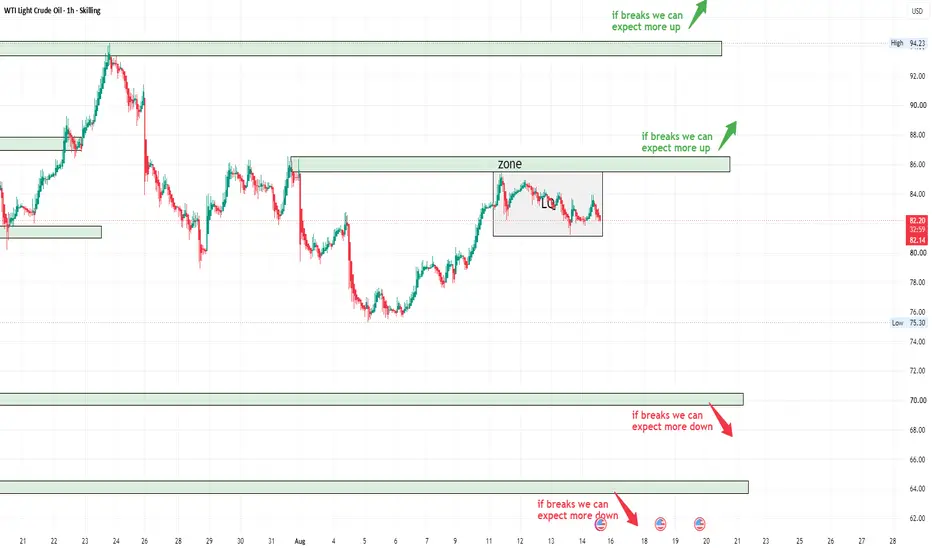
WTI Crude Oil — The Oil Spring Is Getting Tighter
🚀 WTI has recovered strongly from the $75 area, but now price is compressing beneath a major resistance zone around $85.5–87.
🏆Previously:
After the sharp recovery, the market has formed an LQ/sideways structure right below the zone. That makes the current setup especially interesting: liquidity is building while price keeps pressing against resistance. 👀
📈 Bullish scenario
If WTI breaks and holds above the $85.5–87 zone, we could see a strong continuation higher.
The next major target
USOIL 30Min Engaged ( Bearish Reversal Detected )HANZO MARKET LIQUIDITY REPORT
USOIL
Timeframe: 30min (Volume Basis)
Scale: Higher Timeframe Context / Deep Volume analysis
━━━━━━━━━━━━━━━━━━━━━━
Market Observation
This analysis is focusing on structural behavior, liquidity zones, Volume analysis
and key areas of interest within the current range.
━━━━━━━━━━━━━━━━━━━━━━
Market Bias
Full liquidity Map
━━━━━━━━━━━━━━━━━━━━━━
🔥Bearish Reversal
Key Volume Zone : 82.50 Area
━━━━━━━━━━━━━━━━━━━━━━
Structure Factors:
• Higher timeframe Volume reactio
OILUSD: Rally Approaches Major Resistance🔹 OILUSD is maintaining a strong recovery structure after rebounding from the 77.00–78.20 demand area, with successive higher highs and higher lows visible on the chart. Price has now moved into the 84.20–84.80 resistance zone, where recent candles show some hesitation. The broader structure remains constructive, while the upper supply area around 85.20–86.00 could act as another important reaction zone. The recent bullish move also leaves the 81.27 area as a notable liquidity region below curre
USOIL Will Go Down! Short!
Please, check our technical outlook for USOIL.
Time Frame: 1h
Current Trend: Bearish
Sentiment: Overbought (based on 7-period RSI)
Forecast: Bearish
The market is approaching a key horizontal level 83.743.
Considering the today's price action, probabilities will be high to see a movement to 81.530.
P.S
Please, note that an oversold/overbought condition can last for a long time, and therefore being oversold/overbought doesn't mean a price rally will come soon, or at all.
Like and subscri
WTI Still Has a Risk Premium, but the Chart Is Losing PatienceWTI has failed again beneath the 84.5–86.0 supply zone and is back near $80.
This time, the weakness has more than technical support behind it.
U.S. crude inventories jumped by 17.4 million barrels last week to 424.4 million — the largest weekly increase since January 2023. Exports fell sharply, imports increased, and implied product demand softened.
At the same time, both OPEC and the IEA have become more cautious on demand. Oil fell more than 2% on August 13 as the market began paying more
USOIL 30Min Engaged ( Bearish Reversal Detected )HANZO MARKET LIQUIDITY REPORT
USOIL
Timeframe: 30min (Volume Basis)
Scale: Higher Timeframe Context / Deep Volume analysis
━━━━━━━━━━━━━━━━━━━━━━
Market Observation
This analysis is focusing on structural behavior, liquidity zones, Volume analysis
and key areas of interest within the current range.
━━━━━━━━━━━━━━━━━━━━━━
Market Bias
Full liquidity Map
━━━━━━━━━━━━━━━━━━━━━━
🔥Bearish Reversal
Key Volume Zone : 83.50 Area
━━━━━━━━━━━━━━━━━━━━━━
Structure Factors:
• Higher timeframe Volume reactio
Natural Gas: Buyers are pressing the Wedge top again📊 Natural Gas: Buyers are pressing the Wedge top again
Natural Gas is pushing back toward the upper boundary of the rising wedge, with price trading near 2.84-2.85 after holding the lower trendline.
The structure is still constructive: price remains above EMA9, EMA20 and SMA50, while the 200 SMA is lower near 2.75. Buyers are still in control of the short-term trend, but price is now approaching a difficult resistance zone.
The Zig Zag structure also supports the idea of higher swing lows. Aft
USOIL: Bullish pennant meets a mixed EIA Report📊 USOIL: Bullish pennant meets a mixed EIA Report
WTI is still holding inside a bullish pennant after the strong move toward $83.50. Price is consolidating near $82.20-$82.30, and the market is waiting for a clean breakout or breakdown.
The latest EIA report was not simple. U.S. crude inventories jumped by 17.4M barrels to 424.4M barrels, while analysts expected a small draw. On the surface, that is bearish because commercial supply increased sharply.
But the reason matters: the build was driv
USOIL – Bearish Pattern BreakdownBearish View – Technical Rationale:
Price has given a breakdown from the rising support trendline, indicating weakness in the previous bullish structure.
The chart shows a contracting/converging pattern, and the breakdown from its lower boundary strengthens the bearish setup.
After the breakdown, price failed to sustain above the 82.00–82.30 resistance/retest zone, suggesting that the broken support is now acting as resistance.
The formation of lower highs followed by a fresh lower low confirms
WTI OIL: Channel Breakout, Acceleration of Momentum Incoming!Hello Community,
welcome to my new analysis of WTI OIL from a 4-hour timeframe perspective. Since my previous analysis about WTI OIL from a daily timeframe perspective, the price made significant moves and emerged with a bullish momentum breakout as expected. Now, it is in a crucial state that could lead to major bullish events along the line. I have detected the pivotal factors to consider next.
When looking at my chart, we can see how WTI OIL broke out above the upper boundary of this desce
WTI Analysis todayHello traders, this is a complete multiple timeframe analysis of this pair. We see could find significant trading opportunities as per analysis upon price action confirmation we may take this trade. Smash the like button if you find value in this analysis and drop a comment if you have any questions or let me know which pair to cover in my next analysis.
GOLD - The news could trigger a long squeezeICMARKETS:XAUUSD is consolidating within the 4355–4435 range, while the U.S. dollar remains largely stagnant ahead of the upcoming CPI data. Until the release, the market may remain trapped inside the current range while preparing for a potential liquidity manipulation
The U.S. Dollar Index is also consolidating as traders wait for the CPI report. Gold has stalled ahead of this key inflation data, and the initial reaction to CPI could be short-lived as geopolitical risks remain elevated.
A
XLong
Bullish bounce off?WTI Oil (XTI/USD) is reacting off the pivot, which has been identified as an overlap support and could bounce towards the pullback resistance that aligns with the 78.6% Fibonacci retracement.
Pivot: 81.90
1st Support: 79.37
1st Resistance: 88.90
Disclaimer:
The opinions given above constitute general market commentary and do not constitute the opinion or advice of IC Markets or any form of personal or investment advice.
Any opinions, news, research, analyses, prices, other information, or l
XLong
CRUDE OIL Free Signal! Buy!
Hello,Traders!
CRUDE OIL is holding above the horizontal demand area after a strong bullish expansion, with buyers defending the zone and favoring continuation toward higher liquidity.
------------------
Stop Loss: 81.19$
Take Profit: 84.25$
Entry: 82.45$
Time Frame: 3H
------------------
Buy!
Comment and subscribe to help us grow!
Check out other forecasts below too!
XAU/USD | A new hope!By examining the 4H chart of Gold we can see that Gold has finally broken above the old Bearish Breaker and is now retesting the Supply Zone, having swept away the BSL above the 4382 level. Currently Gold is being traded at around 4433.
I expect Gold to go higher considering all the geopolitical factors, as the war has somewhat stopped and the US and IR are not attacking each other right now, and there are news regarding them going back to negotiate on how to end the war and what kind of deal t
XAG/USD | Finally going up!By analyzing the 4H chart of Silver we can see that after CPI news dropped, it surged in price, reaching the Supply Zone but then it was rejected by it and is now being traded at around 66.00, below the Supply Zone.
Now considering all the geopolitical events taking place right now, with an stoppage on war and positive news regarding negotiations, I expect further rise for Silver, breaking above the Supply Zone and then go for the Major BuySide Liquidity pool above the 67.15 level and sweep the