CAD/JPY BEARS ARE GAINING STRENGTH|SHORT
Hello, Friends!
CAD/JPY is trending down which is clear from the red colour of the previous weekly candle. However, the price has locally surged into the overbought territory. Which can be told from its proximity to the BB upper band. Which presents a beautiful trend following opportunity for a short trade from the resistance line above towards the demand level of 113.429.
Disclosure: I am part of Trade Nation's Influencer program and receive a monthly fee for using their TradingView charts in my analysis.
✅LIKE AND COMMENT MY IDEAS✅
Bearish Patterns
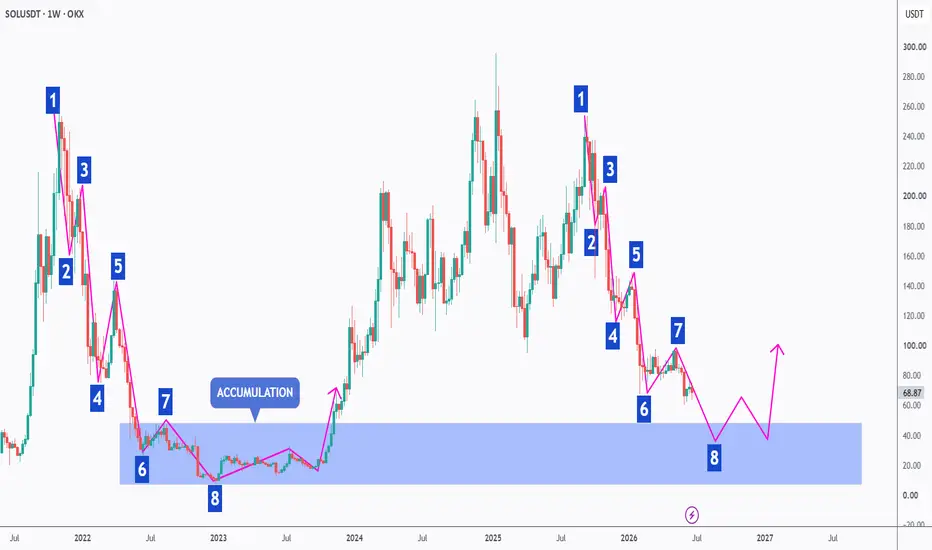
SOL - Is History Repeating Itself?SOL has been following a price cycle that looks remarkably similar to its previous major market cycle. While history never repeats perfectly, it often rhymes, making historical comparisons a valuable tool for understanding where we may be in the current market structure. 📊
In the previous cycle, SOL completed an 8-leg corrective sequence before finally reaching its ultimate bottom. That final Leg 8 produced one last lower low inside the accumulation zone before buyers stepped in and started the next major bullish trend.
📌 If this cycle continues to follow a similar path, SOL now appears to be approaching Leg 8 once again. This suggests that one final lower low could still be ahead before a long-term bottom is established.
That does not mean the market must follow the exact same path. Instead, it gives us a roadmap of what to watch for over the coming weeks.
For now, I remain focused on monitoring price action around the accumulation zone. If history continues to rhyme, this area could eventually offer one of the best long-term opportunities of the cycle.
Will SOL complete one final leg before the next bull run begins? 🤔
⚠️ Disclaimer: This is not financial advice. Always do your own research and manage risk properly.
📚 Stick to your trading plan regarding entries, risk, and management.
Good luck! 🍀
All Strategies Are Good; If Managed Properly!
~Richard Nasr
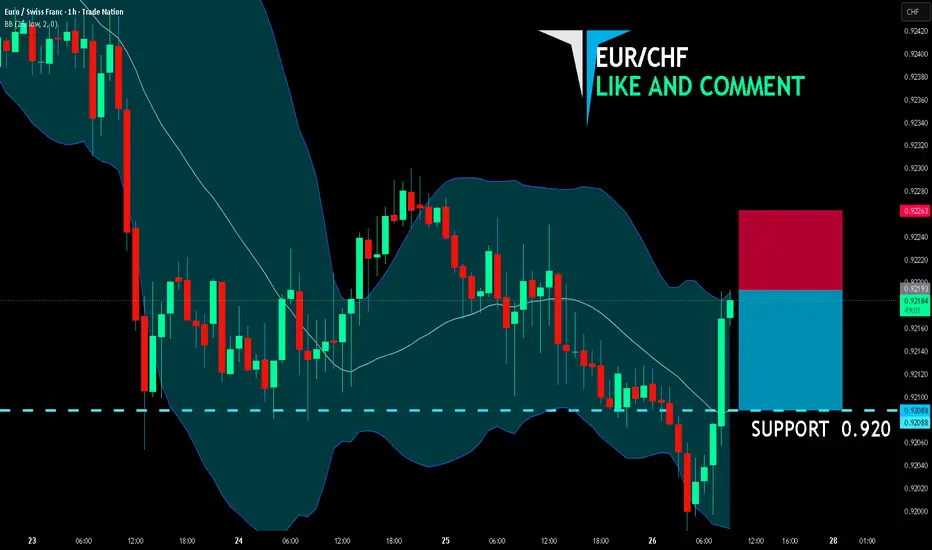
EUR/CHF BEST PLACE TO SELL FROM|SHORT
EUR/CHF SIGNAL
Trade Direction: short
Entry Level: 0.921
Target Level: 0.920
Stop Loss: 0.922
RISK PROFILE
Risk level: medium
Suggested risk: 1%
Timeframe: 1h
Disclosure: I am part of Trade Nation's Influencer program and receive a monthly fee for using their TradingView charts in my analysis.
✅LIKE AND COMMENT MY IDEAS✅
EURAUD Breakout and Potential Retrace!Hey Traders, in today's trading session we are monitoring EURAUD for a selling opportunity around 1.64600 zone, EURAUD was trading in an uptrend and successfully managed to break it out. Currently is in a correction phase in which it is approaching the retrace area at 1.64600 support and resistance area.
Trade safe, Joe.
EUR/AUD BEARS ARE STRONG HERE|SHORT
Hello, Friends!
EUR/AUD pair is trading in a local uptrend which we know by looking at the previous 1W candle which is green. On the 4H timeframe the pair is going up too. The pair is overbought because the price is close to the upper band of the BB indicator. So we are looking to sell the pair with the upper BB line acting as resistance. The next target is 1.639 area.
Disclosure: I am part of Trade Nation's Influencer program and receive a monthly fee for using their TradingView charts in my analysis.
✅LIKE AND COMMENT MY IDEAS✅
GOLD SHORT FROM RESISTANCE
GOLD SIGNAL
Trade Direction: short
Entry Level: 4,013.84
Target Level: 3,950.93
Stop Loss: 4,055.16
RISK PROFILE
Risk level: medium
Suggested risk: 1%
Timeframe: 1h
Disclosure: I am part of Trade Nation's Influencer program and receive a monthly fee for using their TradingView charts in my analysis.
✅LIKE AND COMMENT MY IDEAS✅
NZDCAD 130+ PIPs down-move impending??Overview:
Price was moving in a bullish structure making higher highs and higher lows, respecting the bullish trendline multiple times. The Upswing was met with a longer term bearish trendline intact since Nov-2017, and got rejected as per expectations, marked by red arrow. following to the rejection price started to make lower highs and broke below the bullish trendline and has managed to break below the yellow rectangle which is acting as neckline for the top structure.
Setup:
We are expecting as short term pullback, which would lead to the retest of neckline and after that, fresh short entries could be made below the previous low (from where the pullback started), Stoploss could be placed above the high of the reversal point (from where the price would continues to move in the lower direction). A continued down-move could retest the base (path market by black arrows) as price has shown that tendency multiple times in the past.
Broader outlook for near to mid term seems bearish, and trades aligned with the outlook should be attempted for better hit rate.
Any new perspective you want to add, Please feel free to mention below in the comment.
For Educational Purposes only, Not an Investment Advice, Always use strict Risk management measures.
Regards CrazyTrades247.
EUR/GBP Breakdown Confirms Bearish Triangle, Wave 3 UnderwayIn our May 20 analysis, we highlighted that EUR/GBP had likely completed a complex WXY structure within wave D of a larger A-B-C-D-E triangle and warned that the pair could be entering the final wave E decline. We also noted that wave E was expected to unfold in three legs, with a corrective wave (B) potentially taking the shape of a bearish triangle before another move lower.
Today, a closer look at the 4-hour chart shows that this scenario is playing out as expected. EUR/GBP is finally breaking below the lower boundary of the bearish triangle pattern that developed within wave (B), while also slipping beneath the February and March lows. This breakdown provides an important bearish confirmation and suggests that sellers are regaining control of the broader trend.
Following the completion of the triangle, the market formed a bearish impulsive setup with visible subwaves 1 and 2. As such, EUR/GBP now appears to be entering wave 3 of a larger five-wave bearish impulse. Since third waves are typically the strongest and steepest portion of an impulse sequence, the current decline has the potential to accelerate and extend over the coming sessions and weeks.
While the broader outlook remains bearish, traders should remain aware of short-term intraday pullbacks, which are common during impulsive declines and can provide temporary relief rallies before the downtrend resumes. As long as the recent breakdown remains intact, the path of least resistance appears to be lower, supporting the view that wave (C) of the larger wave E decline is now underway.
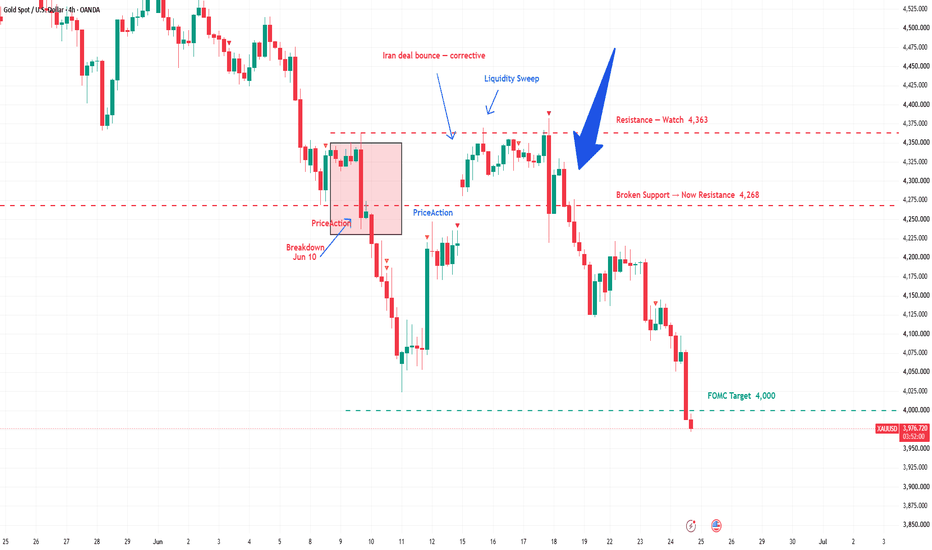
GOLD — $4,000. The Level We Mapped in June Is Here.This is the FOMC target we identified when price was at $4,268.
Every step of this move was mapped:
Jun 10 breakdown through $4,268.
Iran deal bounce — corrective, not a reversal.
Liquidity sweep at $4,363. Resistance held.
Now at $4,040. $4,000 is the next 4H close.
Entry zone: watching $4,000 reaction.
Target if breaks: $3,950.
Invalidation: daily close back above $4,120.
XAUUSD Macro Analysis: Broken TrendlineGold is currently trading within a heavy bearish structure on the High Time Frame. The major uptrend line that guided the market for months was sharply broken back in March. Since that breakdown, bulls have attempted to reclaim this structural line 5 distinct times, resulting in nothing but clean rejections. This confirms that the previous support has firmly flipped into heavy overhead resistance.
The Downtrend Channel: Since mid-April, XAUUSD has been locked inside a well-defined descending channel. Price is currently testing the channel bottom alongside a minor support cluster. While a short-term minor bounce from this oversold region is entirely possible, the broader momentum remains heavily capped.
The Logic Behind the Target: When a major macro uptrend line is cleanly broken and retested as resistance, price historically tends to gravitate back to the absolute origin of the move. This places the Next Logical Target at 3,886 (the baseline where the trendline first formed).
The overall bias for Gold remains strictly bearish. Short-term relief bounces within the channel should be treated with caution. To invalidate this macro downside target, the market needs a decisive breakout and clean structural reclaim of the upper boundary of the downtrend channel. Until then, the path of least resistance points lower.
What are your thoughts on this HTF structure? Let me know in the comments!
EURUSD Big Downside Loading...After a sustained move in a sideways direction for around 1-year, EURUSD has recently broke below it's lowest level of that consolidating range (1.1391),
Long term range breakouts are know for their high success rate, following to it we are expecting big downfall, for the rally that started on 14th Jan 2025 till it had made a prominent high of 1.2082 on 27th Jan 2026, a retracement was long pending. It seems like the move has already started, It has potential to continue till the purple rectangle tagged as 'Important fib retracement zone', its a mid point range of 0.5 & 0.618 Fib retracement level, where it may face some support.
Price structure on the (DXY) Dollar index, also confirms the rational behind this forecast. Do check the related publication segment, I'll be linking earlier published DXY story.
Broader outlook for near to mid term seems bearish, and trades aligned with the outlook should be attempted for better hit rate.
Any new perspective you want to add, Please feel free to mention below in the comment.
For Educational Purposes only, Not an Investment Advice, Always use strict Risk management measures.
Regards CrazyTrades247.
ETH - The Magnet BelowEthereum has remained under pressure for weeks, continuing to print lower highs and lower lows while trading below the falling blue trendline. 📉
Although the recent rebound provided some temporary relief, the broader structure remains bearish, with sellers still controlling the market.
What makes the current setup particularly interesting is the major support zone between $1,350 and $1,500.
📌 At the moment, this zone is acting like a magnet, continuously attracting price toward it.
In trending markets, strong untested support and demand zones often pull price toward them as the market seeks liquidity and unfinished business.
As long as ETH remains below the falling trendline and fails to reclaim key resistance levels, the path of least resistance remains to the downside.
A move toward the $1,350 - $1,500 support zone remains the preferred scenario, where we will then monitor closely for signs of a larger bullish reaction. 🧲
For now, the bears maintain the upper hand, while the major support zone below continues to attract price.
Will Ethereum reach the magnet zone before a meaningful reversal begins? 🤔
⚠️ Disclaimer: This is not financial advice. Always do your own research and manage risk properly.
📚 Stick to your trading plan regarding entries, risk, and management.
Good luck! 🍀
All Strategies Are Good; If Managed Properly!
~Richard Nasr
EURUSD is Nearing a Strong Resistance Area!Hey Traders, in today's trading session we are monitoring EURUSD for a selling opportunity around 1.14400 zone, EURUSD is trading in a downtrend and currently is in a correction phase in which it is approaching the trend at 1.14400 support and resistance area.
Trade safe, Joe.
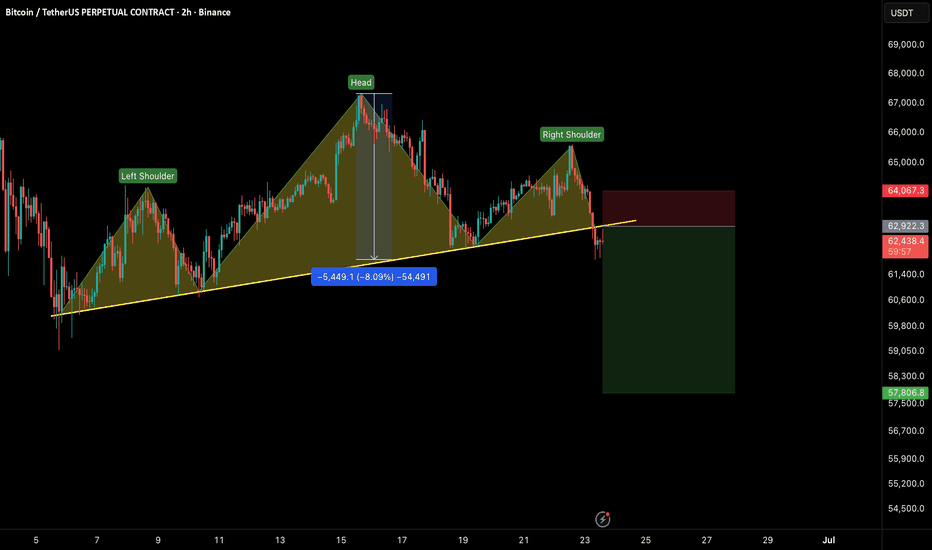
BTC Update – Bearish Structure in Play!Hey Traders! 👋
If you’re enjoying this analysis, smash that 👍 and hit Follow for high-accuracy trade setups that actually deliver! 💹
Bitcoin is forming a clear Head & Shoulders pattern, and price is now breaking down from the neckline support.
Market Structure:
• Head & Shoulders formation
• Neckline breakdown in progress
• Weak bounce after breakdown
Short Trade Setup:
Entry: CMP / retest around $62.5K – $63K
Stop Loss: Above $65.5K
Targets:
• $60K (first support)
• $58K – $57K (major zone)
Outlook:
Further downside expected if price fails to reclaim the broken support
Clean pattern + breakdown = high-probability move
Don’t fight the structure. Follow the trend.
Stay cautious. Manage risk.
EURCAD Reversal Confirmed After CAD Inflation RisesOANDA:EURCAD seems to have formed a Double Top Reversal pattern at a Resistance Level last visited back in April and the CPI readout for CAD, added fuel to the flame as today we see price plummet and give us the Confirmation of the pattern!
The Neckline or Confirmation of the Double Top sits @ 1.6162 being the Low price bounced from between the two peaks and price is currently trading below this level.
If we can get a strong close below this Confirmation, this would satisfy as a Breakout to the pattern, verifying price is really reversing and getting ready to fall further!
If a Retest of the Breakout is successful and price is held below this level, this would generate Shorting opportunities to take price down to the next support level!
- RSI is showing a Bullish Divergence between the two peaks and currently Below 50
- Volume faded during the formation of the pattern and started to rise on the Breakout
- MACD Cross-down event, moving lower, Bearish Histogram bars
BTC Annual Pullback ContinuesMaybe one of the most clear and definitive charts you can use to analyze BTC’s current movement is the annual chart. As price very often aims for previous HLOC, BTC won’t reverse its bearish trend until it touches at least 45-47k, and likely with some overshoot lower to 38-42,000 to sweep liquidity before it makes its next leg up. And Fib levels put the next swing high at around 144k. Use this as guidance for direction…your entries are found at lower time frames of course!
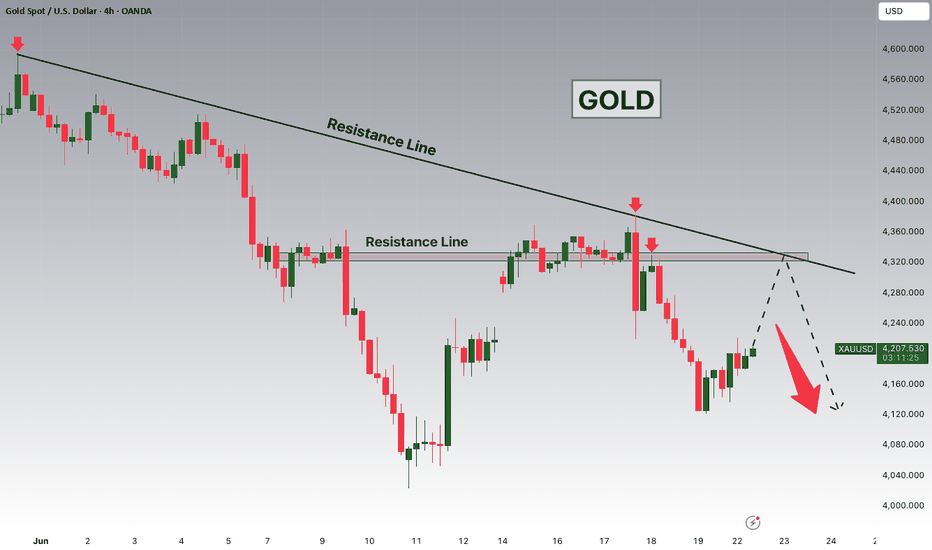
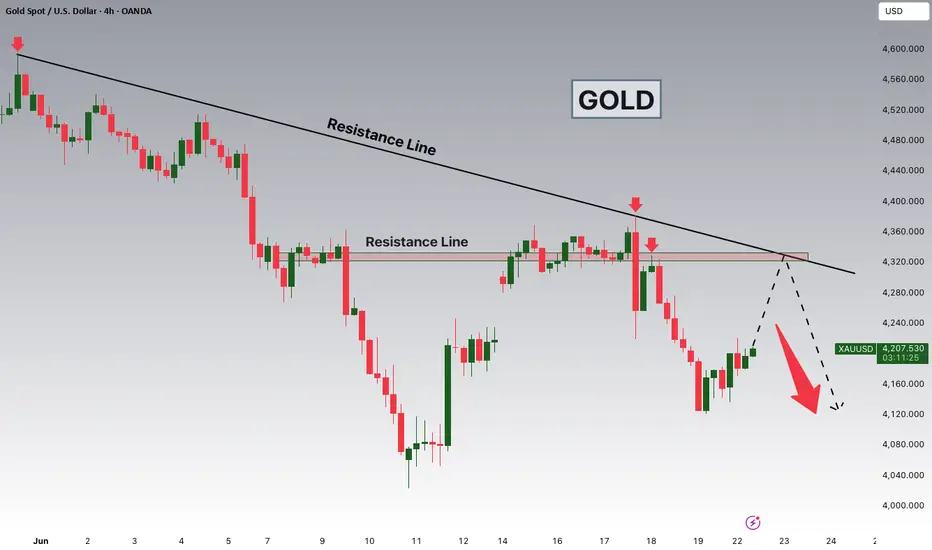
Gold is Nearing an Important Resistance Line!Hey Traders, in today's trading session we are monitoring XAUUSD for a selling opportunity around 4300 zone, Gold is trading in a downtrend and currently is in a correction phase in which it is approaching the trend at 4300 support and resistance area. We would also like to consider the current bullish bias on the dollar that could put extra pressure on the metal.
Trade safe, Joe.
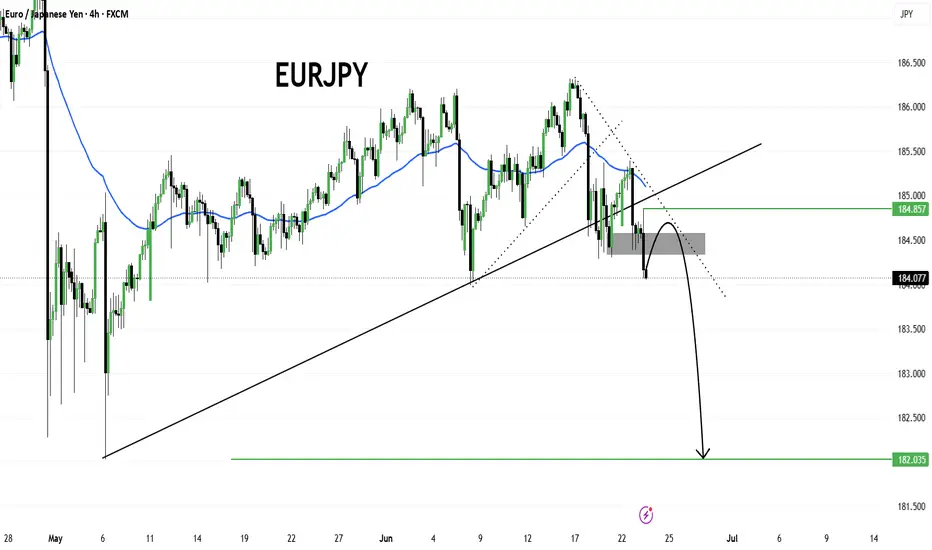
EURJPY – Bearish Breakdown in ProgressEURJPY has broken below a key ascending trendline that had been supporting the bullish structure since early May, signaling a potential shift in momentum.
After rejecting from the recent highs around 186.20, price formed a descending channel and is now consolidating beneath the broken support area. The highlighted zone near 184.50 is acting as a supply/resistance region, and any retest into this area could attract fresh selling pressure.
As long as price remains below 184.85, sellers may maintain control, opening the door for a continuation lower. A clean rejection from the current zone could accelerate the decline toward the major support around 182.03
XAUUSD | THE CITADEL LOST VALUEXAUUSD | THE CITADEL LOST VALUE
Gold has fallen below both governing auctions.
Six-day profile: VAH 4,334.50 | POC 4,191.35 | VAL 4,131.00
NY-open profile: control near 4,188.94
Spot: 4,099.64
This is bearish repricing below value, but the final impulse printed a selling climax near 4,098-4,100.
That means the trend is bearish and the location is late. Do not chase the low.
BULL GATE | 4,108.77
Entry: accepted retest 4,103.48-4,108.77
SL1: 4,097.22 | mitigated shield
SL2: 4,094.62 | tailgate defense
TPq: 4,112.99
TP2: 4,119.08
TP3: 4,122.90 / VAL 4,131.00
BEAR GATE | 4,097.22
Entry: failed reclaim 4,097.22-4,098.32, or rejected repair at 4,106.98-4,108.77
SL1: 4,100.81 / 4,112.99
SL2: 4,103.48 / 4,119.08
TPq: 4,094.62
TP2: 4,082.66
TP3: 4,069.90 / 4,055.11
EVENT AMBUSH | CAIRO
11:00 Eurozone PMIs | 11:30 UK PMIs | 15:15 ADP | 16:45 US PMIs
17:00 Richmond Fed | 20:00 U.S. 2Y auction | 23:30 API oil stocks
Cross-asset route: DXY is firmer, yields are lower, VIX is +16.6%, silver is -4.77%, and GC futures confirm liquidation.
Falling yields without a gold rebound is relative weakness. A long needs price acceptance, not hope.
Acceptance owns the next leg.
Discipline owns the account.
Educational only. Not financial advice or a trade signal.
EUR/USD SHORT FROM RESISTANCE
Hello, Friends!
We are targeting the 1.142 level area with our short trade on EUR/USD which is based on the fact that the pair is overbought on the BB band scale and is also approaching a resistance line above thus going us a good entry option.
Disclosure: I am part of Trade Nation's Influencer program and receive a monthly fee for using their TradingView charts in my analysis.
✅LIKE AND COMMENT MY IDEAS✅
GOLD SELLERS WILL DOMINATE THE MARKET|SHORT
GOLD SIGNAL
Trade Direction: short
Entry Level: 4,209.20
Target Level: 4,122.20
Stop Loss: 4,266.82
RISK PROFILE
Risk level: medium
Suggested risk: 1%
Timeframe: 1h
Disclosure: I am part of Trade Nation's Influencer program and receive a monthly fee for using their TradingView charts in my analysis.
✅LIKE AND COMMENT MY IDEAS✅
GBP/CHF BEARS WILL DOMINATE THE MARKET|SHORT
Hello, Friends!
GBP-CHF uptrend evident from the last 1W green candle makes short trades more risky, but the current set-up targeting 1.065 area still presents a good opportunity for us to sell the pair because the resistance line is nearby and the BB upper band is close which indicates the overbought state of the GBP/CHF pair.
Disclosure: I am part of Trade Nation's Influencer program and receive a monthly fee for using their TradingView charts in my analysis.
✅LIKE AND COMMENT MY IDEAS✅