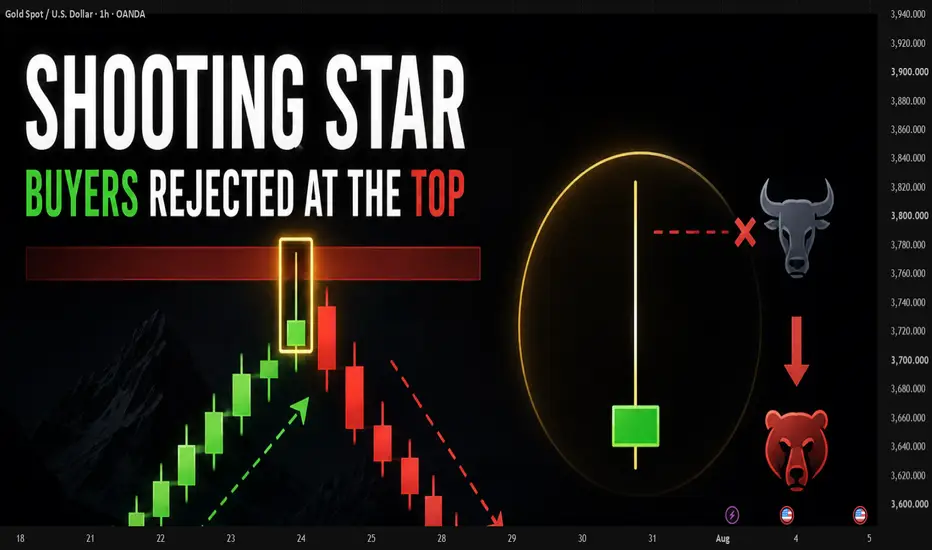
Shooting Star — When Buyers Get Overpowered at the TopShooting Star is a pattern that typically appears at short-term tops or after a rally.
Its defining feature is a small body positioned near the bottom, a long upper wick, and a very short or virtually nonexistent lower wick. The longer the upper wick, the clearer the rejection signal.
The significance of a Shooting Star is that buyers tried to push price higher, but couldn't hold that level. Sellers then fought back and pulled the close down near the low of the candle.
This suggests buying pressure is starting to weaken, especially if the candle forms at a resistance zone.
But like other candlestick patterns, a Shooting Star shouldn't be used in isolation. If it appears within a very strong uptrend without a clear resistance zone nearby, the signal may not be strong enough to conclude a reversal.
How to identify a quality Shooting Star:
Appears after a rally.
Located at resistance or a key price zone.
Has a long upper wick showing strong rejection.
Followed by a bearish confirmation candle or price breaking below the Shooting Star's low.
A common mistake is selling the moment a long upper wick appears. Without confirmation, the market can still continue higher after a brief pause.
A Shooting Star doesn't guarantee price will fall. It only shows that at a higher price level, buyers were rejected. Traders should treat this as a warning signal, then wait for further confirmation from price action.
Reading candles correctly isn't about memorizing pattern names — it's about understanding which side is in control of the market at a key location.  Education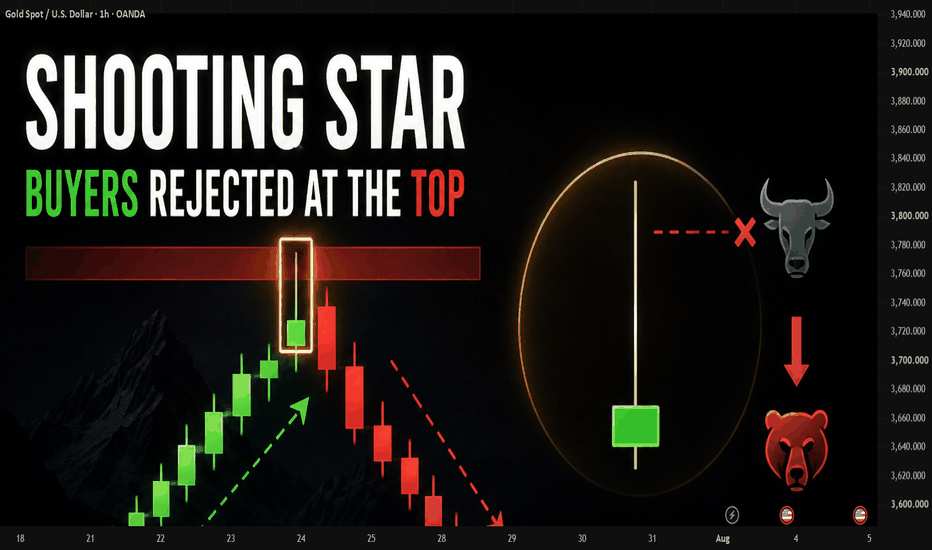
Doji Candlestick — When the Market Starts to HesitateThe Doji candle is one of the most fundamental patterns in Price Action. Its defining feature is that the opening and closing prices are almost identical, resulting in a very small or virtually nonexistent body.
The significance of a Doji isn't whether it's bullish or bearish — it lies in the hesitation it represents.
During that session, buyers tried to push price up, and sellers tried to pull it down, but ultimately neither side truly gained control of the market. Price closing near its opening level reflects a temporary balance between supply and demand.
That said, a Doji shouldn't be read as an immediate reversal signal.
A Doji appearing in the middle of a sideways range usually carries little value. But when it shows up after a strong uptrend, it can be a warning that buying pressure is stalling. Likewise, when it appears after an extended downtrend, it may suggest selling pressure is starting to fade.
To use a Doji effectively, context matters:
Is the Doji forming at support or resistance?
Was the market trending up or down beforehand?
Is there a confirmation candle following the Doji?
Does price break out of this zone of hesitation?
A common mistake is jumping straight into a reversal trade the moment a Doji appears. In reality, a Doji only tells you the market is slowing down — the actual direction still needs to be confirmed by the candle that follows.
Simply put: a Doji isn't a signal to enter a trade right away. It's a cue for traders to watch more closely, because the market may be preparing for a shift in character. Education 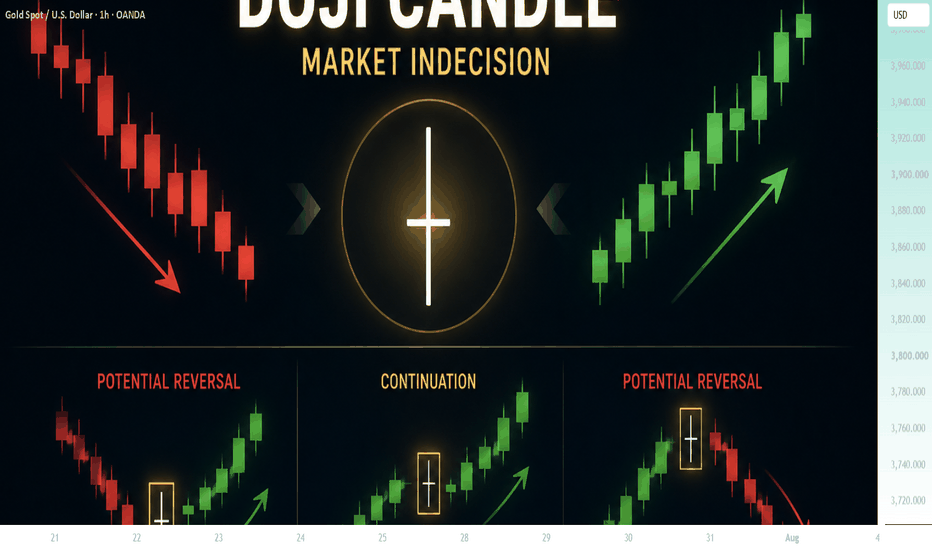
 Short
Short
 Long
Long
XAU/USD | Gold Invalidates The Bearish Scenario & Reclaims $4100By analyzing the #Gold chart on the 2H timeframe, we can see that after the previous update, price started to move higher and the bearish continuation scenario was invalidated.
The market reacted strongly following Kevin Warsh’s hawkish remarks, the decision to keep interest rates unchanged, and today’s U.S. GDP and PCE data. Together, these developments supported Gold and pushed price toward higher levels.
Currently, Gold is trading around $4113. If buying pressure continues and price manages to stabilize above the key $4100 level over the next four hours, the probability of another bullish move will increase. The next short-term upside targets to monitor are $4120, followed by $4130 and then $4140. For now, the reaction around $4100 remains the main confirmation for this bullish scenario. This analysis will be updated as the market evolves.
Please support me with your likes and comments to motivate me to share more analysis with you and share your opinion about the possible trend of this chart with me !
Best Regards , Arman Shaban Long 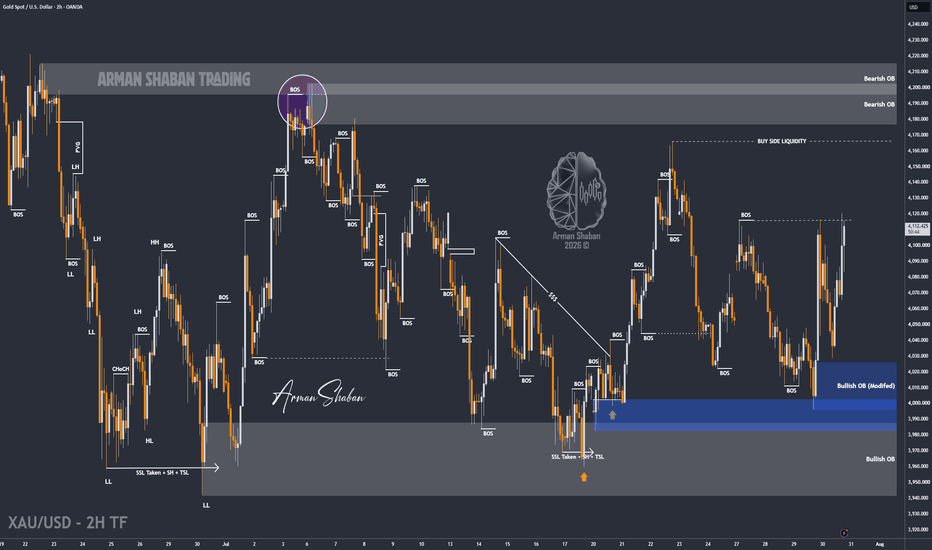
ETHUSDT – Bearish Rejection at 1,980 Supply, Eyes on 1,720 SweepETH tapped the local high supply zone at 1,980, filled the gaps above, and is now set for a move lower.
Why This Level Matters:
Price pushed into the 1,980 supply zone and rejected. With the upside gaps now filled, the path of least resistance points down toward the untested demand below.
Gameplan / Primary Scenario:
Sell any retest of the 1,910–1,980 zone and ride the continuation lower. First target sits at 1,860, followed by the 1,780 shelf, with the deeper draw toward 1,720 where liquidity rests. As long as price holds below 1,980, the short remains in play.
If this added value, boost it forward. What are your thoughts?
Swallow Academy  Short
Short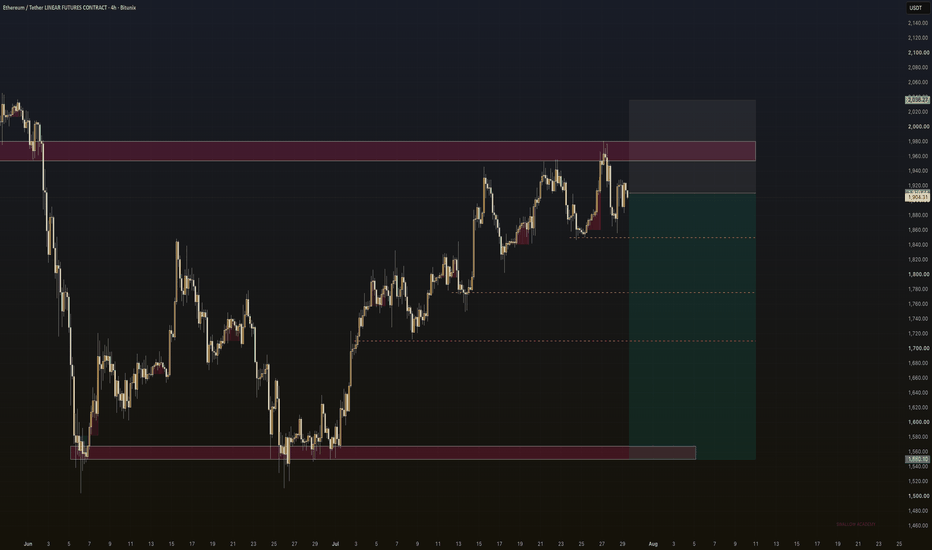
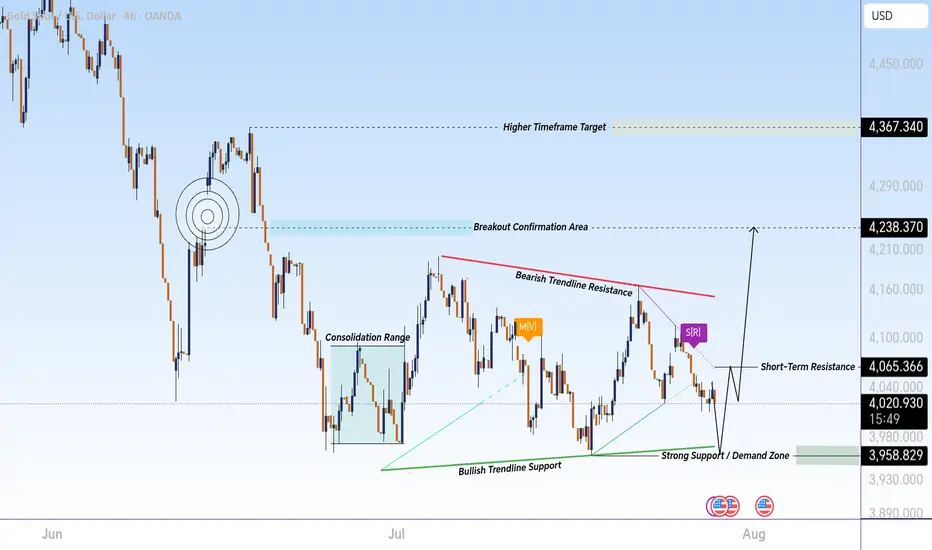
Gold 4H Forecast | 3,958 Support to 4,238 Resistance PathThis XAU/USD (Gold) 4H chart presents a professional price action and market structure analysis, highlighting key trendlines, support and resistance levels, liquidity areas, and a potential reversal scenario.
Gold has been trading inside a corrective structure after a strong bearish move. The chart shows a clear battle between sellers defending the descending resistance trendline and buyers protecting the ascending support trendline. This formation creates a compression zone where price is preparing for a potential breakout.
The red descending trendline represents dynamic resistance, showing where sellers have repeatedly rejected higher prices. A confirmed breakout above this trendline could indicate a shift in short-term momentum and open the way toward higher resistance levels.
The green ascending support trendline represents buyer strength and demand, where price has repeatedly found support. The 3,958.829 area acts as a major liquidity and demand zone, where a possible liquidity sweep could occur before the next expansion move.
Key levels:
3,958.829 — Strong Support / Liquidity Zone
4,065.366 — Short-Term Resistance & Decision Area
4,238.370 — Major Breakout Target
4,367.340 — Higher Timeframe Resistance / Final Target Zone
Market scenario: If buyers continue defending the support zone and price breaks above the descending resistance line, Gold may enter a bullish expansion phase toward 4,238 and 4,367 resistance areas.
However, failure to hold the support zone may lead to further downside and continuation of the corrective structure.
This analysis is created for educational purposes, explaining how traders study trendlines, support/resistance, liquidity zones, market structure, and breakout confirmations before making trading decisions. Long 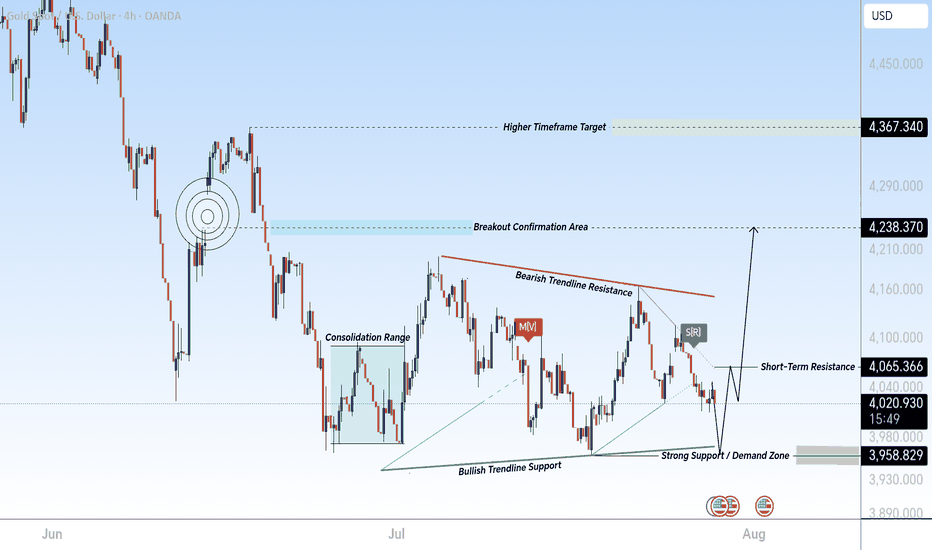
 Long
Long
Short 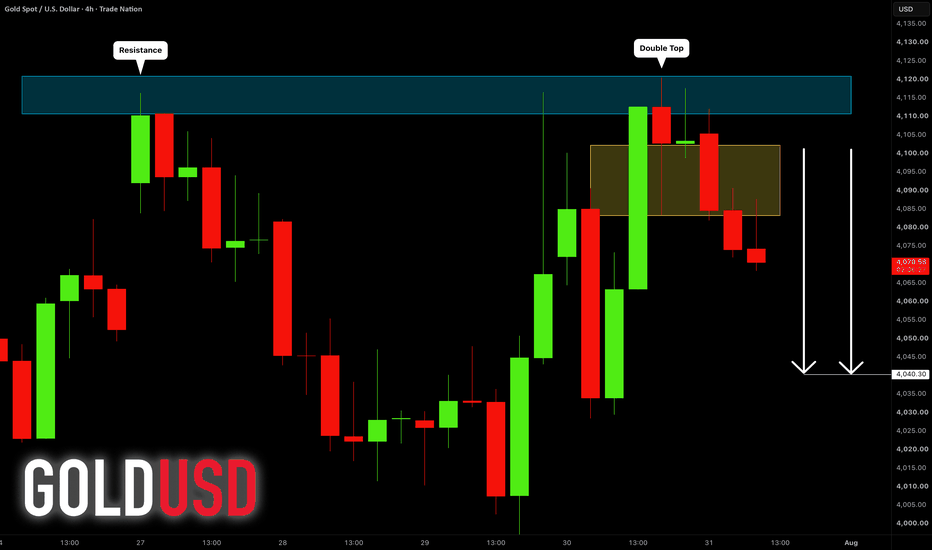
 Short
Short
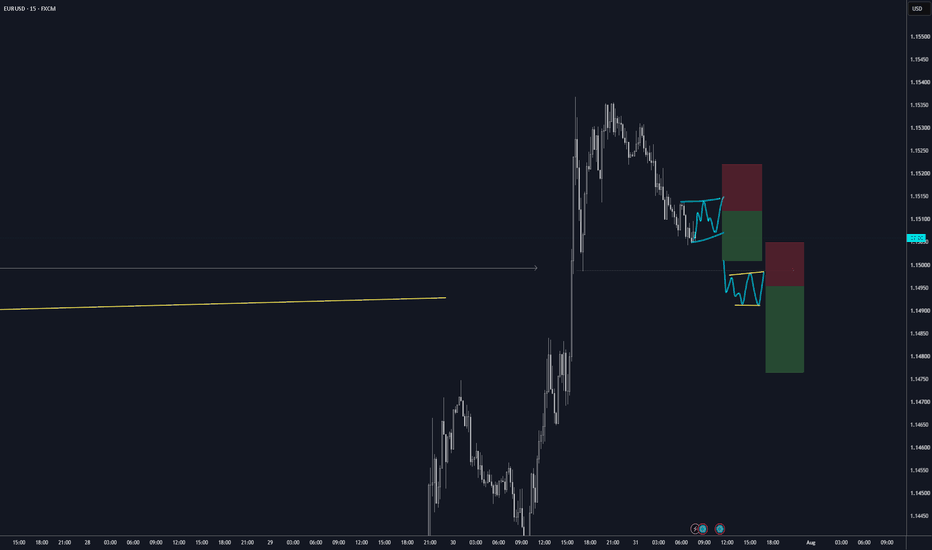
The #1 Reason To Buy This StockGoldman Sachs (NYSE: GS) – Pullback
Opportunity Within an Uptrend
Goldman Sachs is showing a
technical setup that may present
a buying opportunity as
multiple timeframes begin to align.
Weekly Chart
The weekly trend remains constructive,
with price trading above the 13 EMA,
indicating that the longer-term uptrend is still intact.
At the same time, Williams %R is
below -50, suggesting the stock is in
a pullback rather than an overextended
advance. Pullbacks within established
uptrends often provide opportunities
for the trend to resume.
Daily Chart
The daily chart supports the weekly outlook.
Williams %R remains below -50, indicating
that the current correction is still
in progress and momentum has
not yet become overbought.
This suggests the stock may be approaching
an area where buyers begin to regain control.
4-Hour Chart
The 4-hour timeframe provides the entry
signal. A Morning Star candlestick pattern
has formed, indicating that bearish
momentum may be weakening
and buyers are beginning to step in.
Williams %R also remains below -50,
adding further evidence that the
recent pullback could be nearing
completion.
Technical Summary
Weekly price remains above the 13 EMA.
Weekly Williams %R is below -50.
Daily Williams %R is below -50.
4-hour Williams %R is below -50.
A Morning Star pattern has formed on the 4-hour chart.
Conclusion
The overall technical structure suggests
that Goldman Sachs remains in a
healthy longer-term uptrend while
undergoing a controlled pullback.
The alignment of the weekly trend,
daily momentum, and the bullish
reversal pattern on the 4-hour
chart makes this a stock worth
monitoring for confirmation of
continued upside.
As always, wait for confirmation
before entering a position and
apply appropriate risk management.
Rocket boost this content to learn more
Disclaimer:Trading is risky please use
a simulation trading account before
you trade with real money
 Long
Long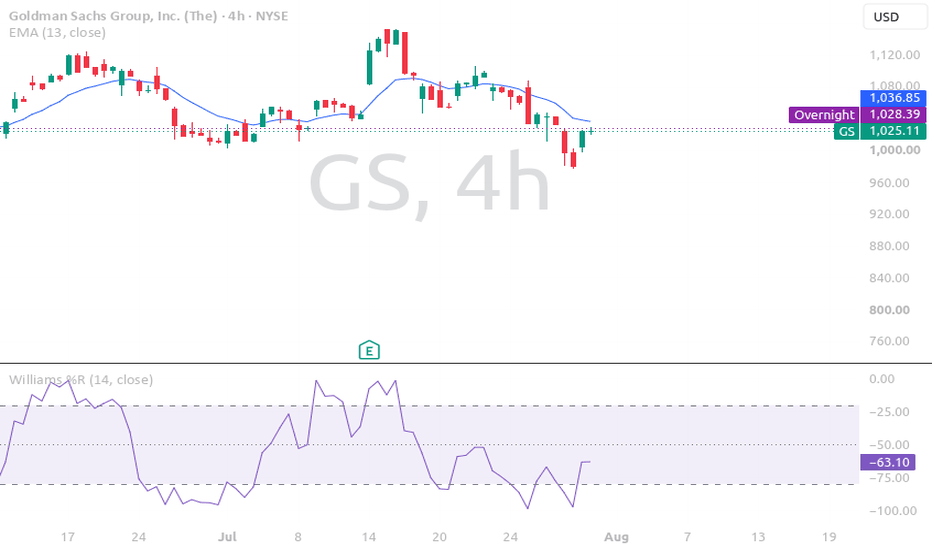
 Long
Long
Long 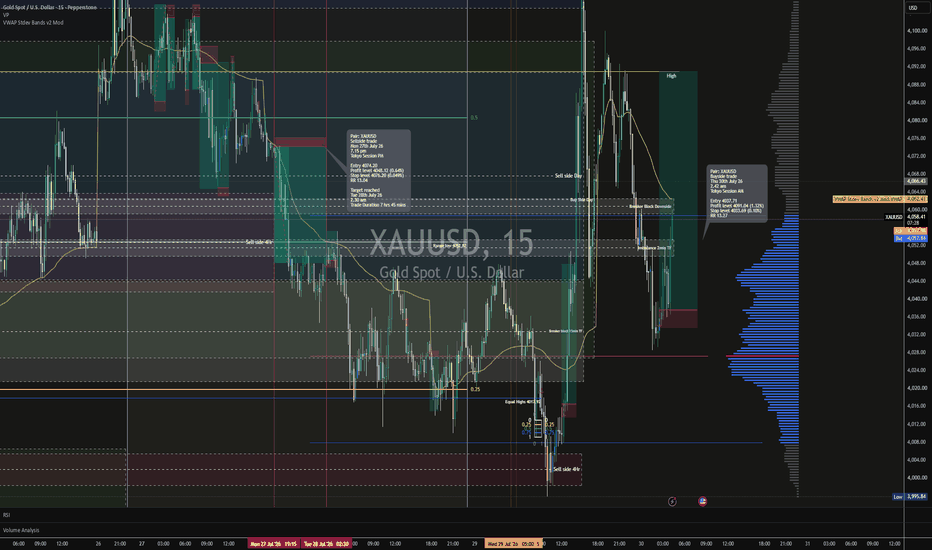
 Long
Long