ETHUSD: Golden OTE Zone (0.72–0.78) + MSS | Long to 1975 BSLExecutive Summary & Signal Overview
📍 Asset: ETH/USD (Ethereum / US Dollar)
🐂 Position Type: Limit Buy / Long Entry
🏁 Buy Zone: 1,875.00 – 1,880.00
🛡️ Stop Loss (SL): 1,856.83 (Below Fibonacci Level 1 / Swing Low)
🎯 Target 1 (BSL 1): 1,925.00 (Fib Anchor Peak)
🎯 Target 2 (BSL 2): 1,952.00 (Intermediate High)
🎯 Target 3 (BSL 3): 1,975.00 (Major Range High)
⚖️ Risk-to-Reward (R:R): 1 : 4.4+
🔍 2. Technical & Confluence Breakdown
📐 A. Fibonacci Golden Ratio / OTE Zone (0.72 – 0.78)
Drawing the Fibonacci retracement from the recent expansion low (1,857) to the local swing high (1,925), the $1,875 – $1,880 area lines up precisely with the 0.72 – 0.78 Optimal Trade Entry (OTE) golden zone.
This level acts as a high-probability discount area where institutional buyers re-enter long positions before continuing impulse moves.
🔄 B. Lower Timeframe Market Structure Shift (MSS)
Prior to the current push, price swept the lower Sell-Side Liquidity (SSL) and responded with strong bullish displacement, creating a clean Market Structure Shift (MSS) to the upside.
The structural shift confirms that short-term seller momentum has exhausted and buyers are in control of order flow.
📦 C. Demand Zone Confluence
The $1,875 – $1,880 region overlaps with an unmitigated 15m order block / demand zone responsible for breaking the local structure. Retesting this block provides a strong risk-defined entry.
🧲 D. Unfilled Buy-Side Liquidity (BSL) Targets
Multiple clean swing highs sit stacked at 1,925.00, 1,952.00, and ultimate liquidity resting at 1,975.08. These pools represent prime exit liquidity for the move.
🛡️ 3. Execution & Risk Management Guidelines
Invalidation Level:
A candle close below $1,856.83 invalidates the OTE setup, signaling that the move was a temporary pullback rather than a structural reversal.
Partial Profit Protocol:
At TP 1 ($1,925.00): Lock in 30–40% partials and secure the trade by moving Stop Loss to Breakeven (BE).
At TP 2 ($1,952.00): Take another 30% off the table and trail stops under lower-timeframe higher lows.
At TP 3 ($1,975.00): Full exit or leave a minimal runner for higher timeframe imbalances.
⚠️ Educational Disclaimer: This signal analysis is strictly for educational, analytical, and back testing purposes only. It is not financial advice. Always adhere to strict risk management and never risk more capital than you are prepared to lose! 🛡️✨  Long
Long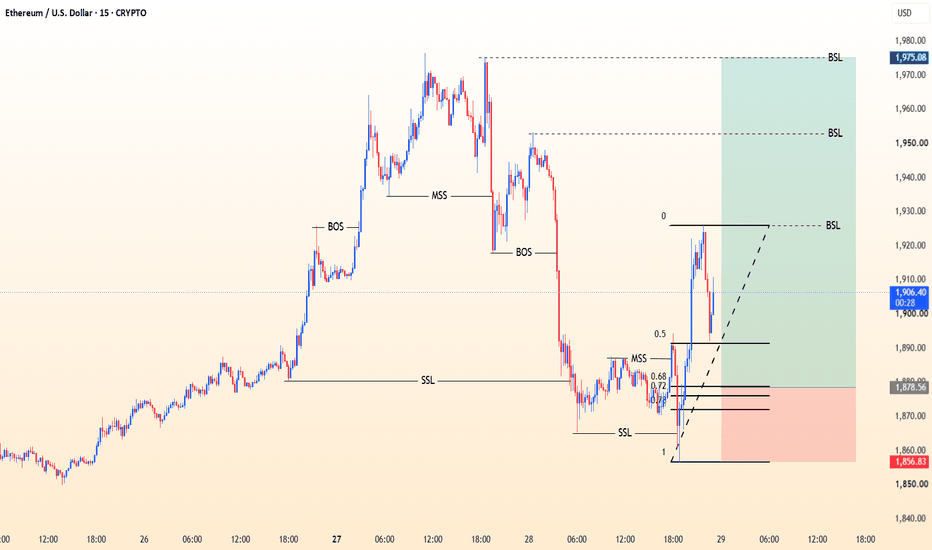
What is Dynamic Liquidity Zones? Supply & Demand Trading Basics
Today, we will discuss the concept of dynamic liquidity zones in trading.
I will explain to you the difference between static and dynamic liquidity zones.
You will learn how to identify and use them properly.
Take notes, and let's get started.
Let's start by discussing static liquidity zones.
Static liquidity zones are liquidity clusters that do not shift with time.
Once they are identified on a price chart, they remain fixed no matter when the price returns to them.
That's an example of a static liquidity supply zone on GBPUSD.
It is a horizontal structure cluster that accumulates selling orders.
Whenever the price tests it, this zone will remain at the same levels.
Now, compare that to EURUSD pair.
As you can see, we have a significant static horizontal supply cluster.
But, it is just a part of a major dynamic liquidity zone that is based on a strong vertical structure - a trend line and horizontal demand zone.
The upper boundary of that area will be higher with time.
This zone will grow, and selling orders will be concentrated within it.
Dynamic liquidity supply zone is a combination, a confluence of a strong trend line and a static liquidity supply zone that constantly changes over time.
Above is the example of a static liquidity demand zone on EURJPY.
It is a horizontal structure cluster that accumulates buying orders.
Whenever the price tests it, this zone will remain at the same levels.
Examine the price action on CADCHF pair.
There is a significant horizontal liquidity demand zone below current prices.
But, this liquidity zone is part of a larger, dynamic demand zone.
This dynamic demand cluster is based on a vertical structure - a trend line and this horizontal demand zone.
With time, this zone will expand , becoming wider and wider.
We will expect that buying orders will be concentrated within that entire area.
Dynamic liquidity demand zone is a combination, a confluence of a strong trend line and a static liquidity demand zone that constantly changes over time.
Please note that, depending on the positioning and the direction of a trend line, a dynamic liquidity zone can expand or contract.
On EURGBP pair, we can see a contracting liquidity supply zone based on a falling trend line and a horizontal supply cluster.
And a contracting demand zone based on a rising trend line and a horizontal static demand cluster.
Both dynamic areas become smaller over time.
Your ability to identify dynamic liquidity zones provides a deeper understanding of a concentration of buying and selling orders on the market.
Integrate this knowledge into your analysis, and good luck to you in trading.
❤️Please, support my work with like, thank you!❤️
I am part of Trade Nation's Influencer program and receive a monthly fee for using their TradingView charts in my analysis.
 Education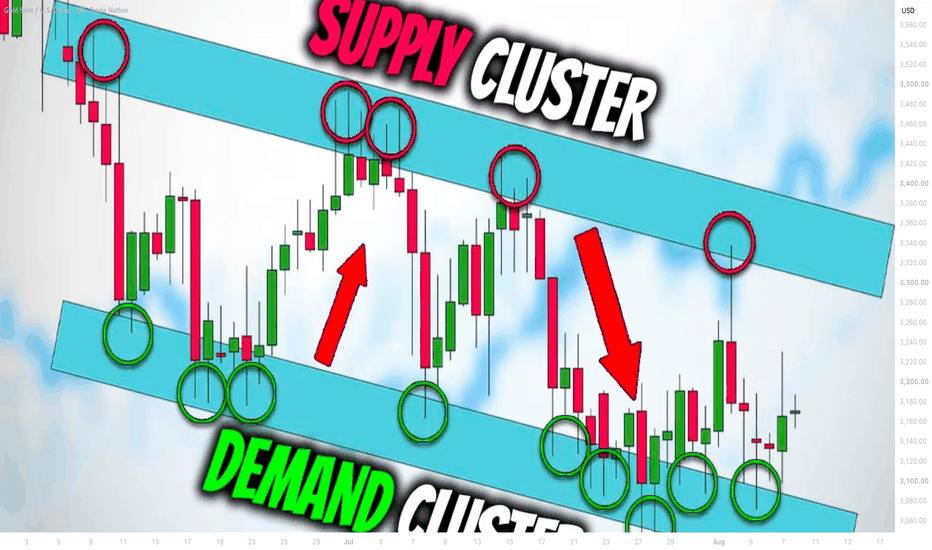
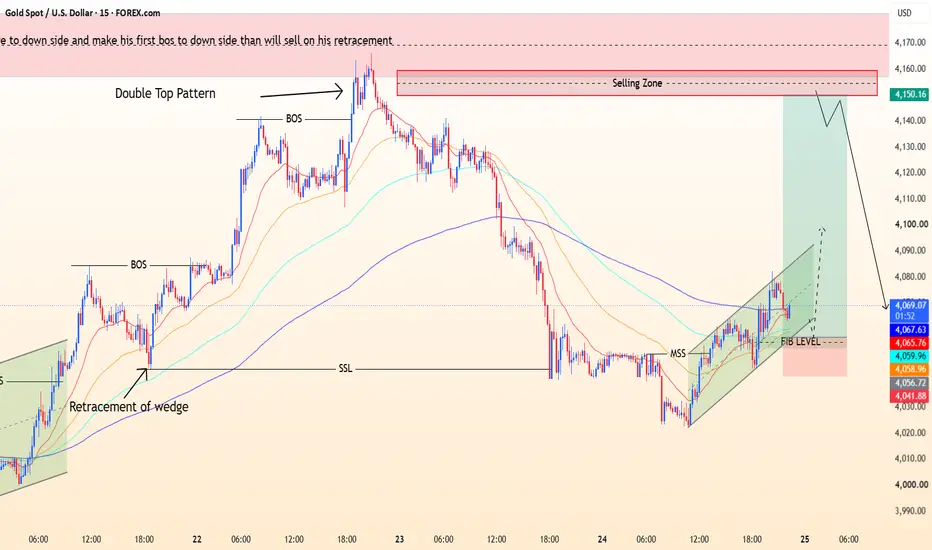
XAU/USD Bullish Trade Setup Demand & Fib Confluence🔍 Technical Confluence Breakdown
⚡ Market Structure Shift (MSS): Price swept sell-side liquidity (SSL) around ~4,020 and broke structure to the upside, flipping short-term 15-minute momentum from bearish to bullish.
🎯 Premium Demand & Fib Zone (4,050 – 4,056): Retracements into the 0.72 – 0.78 Fibonacci levels align directly with lower channel support and fresh demand, offering a high-probability Optimal Trade Entry (OTE).
🏁 Profit Target & Major Resistance: Upside target points toward the 4,150–4,160 Selling Zone, where the prior double top and strong higher-timeframe resistance lie.
🛡️ Risk & Execution Parameters
🛑 Stop Loss / Invalidation: Placed around ~4,041 (just below the structural swing low).
⚖️ Risk-to-Reward Ratio: Entering near ~4,056 with a ~15-point stop and targeting ~4,150 (~94-point gain) yields an excellent > 1:6 R:R ratio.
⚠️ Disclaimer: This chart analysis is strictly for educational and informational purposes only. It is not financial advice or a signal to trade. Always perform your own analysis and practice strict risk management before opening any positions! 💸📊 Long 
 Long
Long
Geopolitical overwhelm soft US data, pressuring the Silver priceHere is the professionally rewritten text, meticulously adhering to all of your formatting, tone, and grammatical constraints.
Despite softer US CPI and PPI prints recently, silver prices failed to rally due to cooling industrial demand in China and persistent hawkish rhetoric from Fed officials.
The recent deceleration in monthly US CPI and PPI metrics fails to soften the Fed's hawkish stance. Fed Governor Cook remains prepared to act if price progress stalls in the coming months, while Fed Chair Warsh characterized the inflation battle as an "incomplete mission," signaling that the central bank might adjust interest rates to anchor inflation. Cook also noted that a stable labor market allows the Fed to prioritize its price stability mandate, which might streamline future interest rate interventions.
The swap market reacted moderately to the soft US CPI and PPI prints, maintaining full pricing for more than one rate hike this Sep.
On the demand side, Solar PV demand for silver in China might contract by over 20%. This contraction cools the primary driver of industrial silver consumption following years of robust expansion, likely applying downward pressure on silver prices over the near term.
From a technical perspective, XAGUSD retraced to test the 57.00 resistance level and held above it. However, the asset remains embedded in a primary downward trend beneath diverging bearish EMAs, pointing to a sustained bearish trajectory.
If XAGUSD sustains its position above 57.00, price action might consolidate within the 57.00 - 59.00 territory.
Conversely, a decisive close below 57.00 might accelerate the downward extension, exposing the subsequent support floor at 54.40.
By Van Ha Trinh - Financial Market Strategist at Exness  Short
Short
 Long
Long
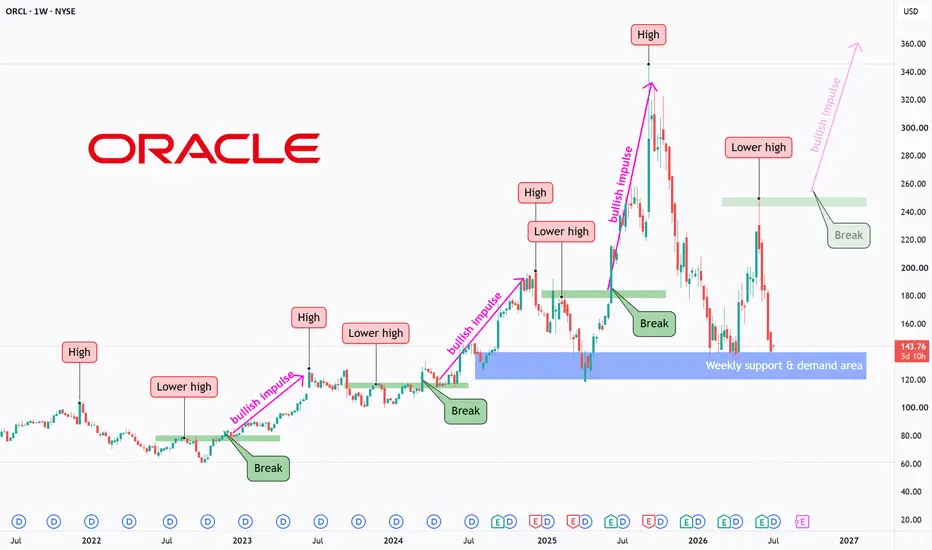
ORCL - History Repeating Itself?ORCL is one of the world's leading enterprise software and cloud computing companies, providing database solutions, cloud infrastructure, and AI-powered business applications. The stock has remained a popular long-term investment due to its strong market position and consistent business growth.
Looking at the broader price structure, an interesting pattern stands out. major highs followed by lower highs, and once those lower highs were broken, the stock entered strong bullish impulse moves.
Price is now testing a major weekly support and demand area, creating an attractive location to monitor for potential buying opportunities on lower timeframes.
⭕If buyers respond from the current demand zone, the first objective would be a move back toward the previous major high.
⭕A successful break above that high could confirm the same historical pattern once again, opening the door for a new bullish impulse and potentially fresh all-time highs.
The reaction from this support area may reveal whether buyers are ready to challenge the previous high, or if the current correction still has room to develop.
⚠️ Disclaimer: This analysis reflects my personal market view and is not financial advice.
Rayan Nasser
#ORCL #Oracle #Stocks #Investing #TechnicalAnalysis #PriceAction #MarketStructure #CloudComputing  Long
Long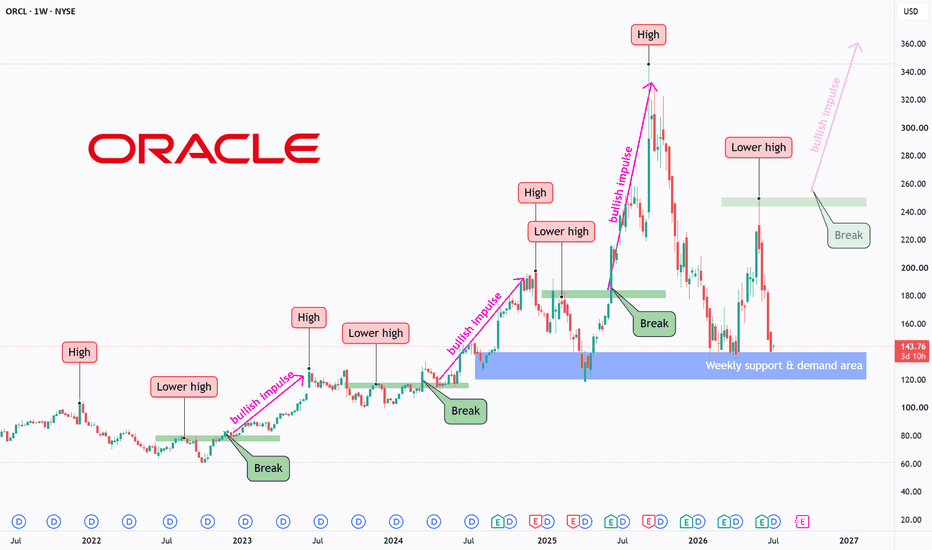
 Long
Long
Long 
XAU/USD (Gold) Technical Analysis – 1H Time FrameXAU/USD (Gold) Technical Analysis – 1H Time Frame
Gold remains in a bearish market structure on the 4-hour time frame, indicating that the dominant trend continues to favor the downside. On the 1-hour chart, price is currently approaching a significant resistance area between 4,090 and 4,100, where selling pressure is expected to emerge.
A higher liquidity zone is positioned between 4,110 and 4,116. If price extends into this area and forms a confirmed bearish rejection—such as a strong rejection candle, bearish engulfing pattern, or market structure shift—it could present a high-probability short-selling opportunity aligned with the prevailing higher-time-frame trend.
Key Resistance Zones
4,090 – 4,100: Primary resistance zone.
4,110 – 4,116: Liquidity zone where sell-side opportunities may develop following bearish confirmation.
Bearish Confirmation Required No short position should be considered without clear confirmation from price action. Patience and disciplined execution remain essential.
Downside Technical Targets
Target 1: 4,043
Target 2: 4,016
Target 3: 3,971
Trading Outlook As long as the 4-hour bearish trend remains intact, rallies into resistance should be viewed as potential selling opportunities rather than buying opportunities. Traders should wait for confirmed bearish price action before entering any short position.
Regards Expert Trader Short 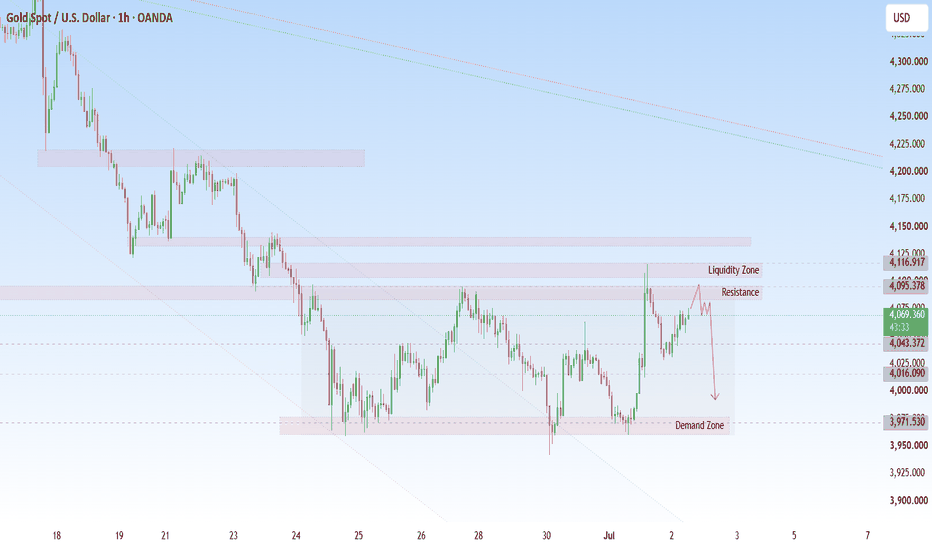
Long 
 Long
Long
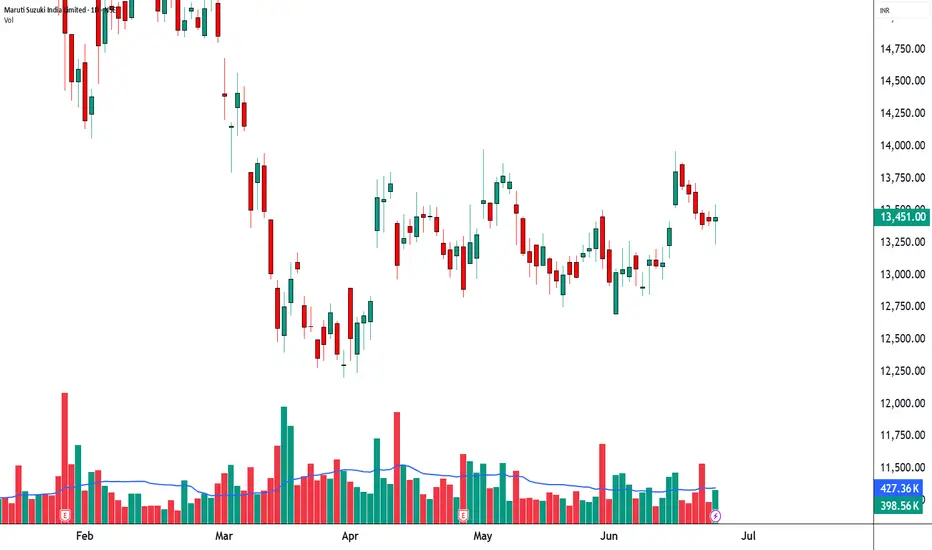
MARUTI SUPPLY & DEMAND LIQUIDITY MAP 5 MTF╔══════════════════════════════════════════════════════════════════════╗
📊 SUPPLY & DEMAND LIQUIDITY MAP | MARUTI SUZUKI (NSE: MARUTI)
╚══════════════════════════════════════════════════════════════════════╝
⏱️ Timeframe: 05-Minute Intraday
📅 Session: 24-JUN-2026
💰 Last Price: 13,430.00 (-0.22%)
📈 Consolidation Phase
──────────────────────────────────────────────────────────────────────
🟪 SUPPLY LIQUIDITY MATRIX
🎯 Major Supply Box
13,509.00 – 13,549.00
↳ Institutional Distribution Ceiling
⚡ Intermediate Supply Box
13,441.00 – 13,478.00
↳ Active Overhead Supply Cluster
──────────────────────────────────────────────────────────────────────
🟩 DEMAND LIQUIDITY MATRIX
🛡️ Immediate Demand Shelf(Tested Zone)
13,398.00 – 13,420.00
↳ Near-Term Liquidity Support
💎 Macro Demand Box 1
13,301.00 – 13,315.00
↳ Institutional Accumulation Zone
🌪️ Macro Demand Box 2
13,240.00 – 13,259.00
↳ Session Demand Extreme
──────────────────────────────────────────────────────────────────────
⚙️ STRUCTURAL CONDITIONS
❖ Current State
Rangebound Liquidity Rotation
❖ Market Character
Price positioned between active supply and demand clusters
🚨 Hard Invalidation Level
13,240.00
A decisive candlestick close beneath this zone invalidates the current demand structure.
──────────────────────────────────────────────────────────────────────
💬 COMMUNITY EXCHANGE
Is MARUTI more likely to encounter rejection inside the Intermediate Supply Box, or are you monitoring for demand absorption near the Immediate Demand Shelf?
──────────────────────────────────────────────────────────────────────
⚠️ DISCLAIMER
This publication is intended solely for educational and informational purposes based on institutional order block methodology and market structure analysis. It does not constitute investment advice, research, recommendation, or solicitation to transact in any security. Market participation involves risk. Please consult a SEBI-registered investment adviser before making financial decisions.
╚══════════════════════════════════════════════════════════════════════╝
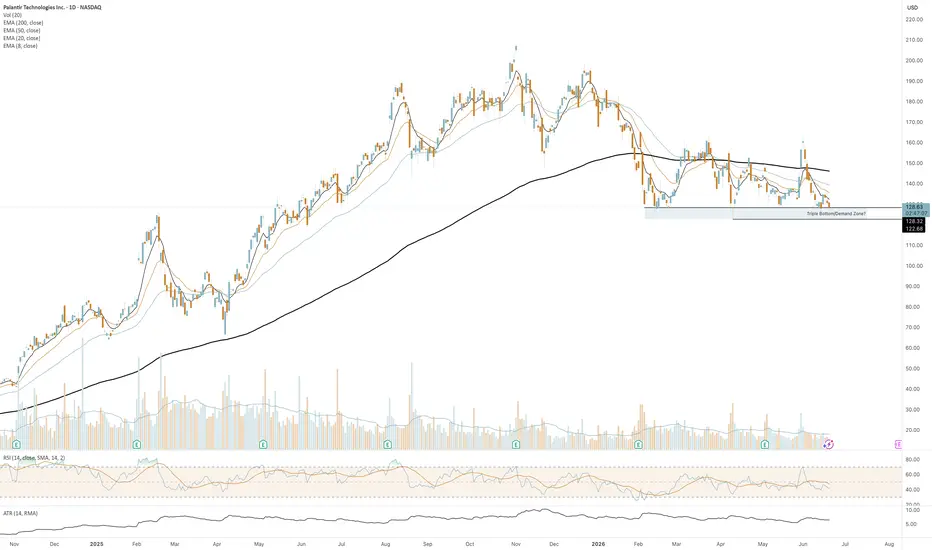
Honda Tests Weekly Flip Zone — Uptrend, Valuation and Seasonals Honda Motor Company (NYSE: HMC) is trading at $25.64 — just $0.11 above the proximal edge of a weekly Flip demand zone scored 10.3/10 by the Blueprint engine, the highest composite score across all 308 symbols in today's scan. All six zone qualifiers and the Level-on-Level (Big Brother) bonus fired at maximum. The fundamental picture is clean: valuation, seasonality, and the weekly uptrend all confirm the long — the setup favors a continuation move toward $26.67.
━━ MULTI-TIMEFRAME ANALYSIS ━━
HTF (Weekly):
Location: Price in the lower third of the weekly HTF range — technically cheap
Trend: Uptrend — higher highs and higher lows confirmed on the weekly structure
LTF (Daily — zone details):
Zone Type: Flip Zone — former supply engulfed and converted to demand (Originality: 12/10)
Zone Range: $24.96 (distal) — $25.53 (proximal)
Zone Quality Score: 10.3/10
Q1 Departure: 10/10 — explosive institutional rejection leg-out
Q2 Base Duration: 10/10 — well-formed multi-candle base at origin
Q3 Freshness: 10/10 — untested since formation; first return
Q4 Originality: 12/10 — Flip zone bonus (former supply flipped to demand)
Q5 Profit Margin: 10/10 — strong multiple of zone height traveled before return
Q6 Arrival: 10/10 — clean, fast impulse arrival
LOL Bonus: 10/10 — Big Brother HTF zone aligns with LTF zone
━━ FUNDAMENTAL BIAS — 4/5 ALIGNED ━━
Valuation (Rule #1 Gate): Bullish vs DXY + ZB + GC references — PASS
Location: Lower 33% of weekly range — technically cheap
Seasonality: 5/10/15yr lookbacks all point higher for June
COT: Neutral — equities have no futures COT data (not opposing)
Trend: Weekly uptrend — higher highs + higher lows confirmed
Consensus: 4/5 aligned bullish | Trade context: Standard | Risk: 0.5%
━━ TRADE PLAN ━━
Entry: $25.53 — limit at zone proximal (E1)
Stop Loss: $24.96 — zone distal (HTF weekly income stop)
Breakeven: Move stop to entry at $25.82 (half-distance to T1)
Target 1: $26.10 (+1R) — move stop to breakeven
Target 2: $26.67 (+2R) — take 50% partial, trail remainder
Target 3: $27.25 (+3R) — trail with-trend only
R:R: 1:2.0 to T2 | Timeframe: Weekly HTF / Daily confirmation
Current price $25.64 is $0.11 above entry. Place a limit at $25.53, or wait for a daily reversal candle inside the zone for confirmation.
━━ INVALIDATION ━━
The bullish thesis is invalidated if HMC closes below $24.96 on the weekly — that breaks the zone distal and signals institutional buyers are not defending this level. A macro risk-off event (trade tariff shock, yen crisis, auto demand collapse) would also cancel the setup regardless of price level.
Failed flip zone = full exit. Do not average in. Wait for a new HTF setup to form.
━━ WHAT THIS SETUP TEACHES: THE FLIP ZONE ━━
A Flip zone is Blueprint's highest-conviction zone type — rated 12/10 on the originality qualifier.
When a powerful bullish impulse completely engulfs an old supply zone, the trapped sellers are stopped out. What remains is the institutional buying pressure that drove the engulfment candle. When price returns to test the Flip zone for the first time , there are no sellers left — only buyers defending their original position.
The 10.3 composite score reflects the Big Brother LOL confirmation: a daily demand zone stacked inside a weekly demand zone. Two independent groups of institutional buyers defending the same price area at two timeframes. First touch of a fresh Flip zone = highest-probability Blueprint entry.
━━ YOUR TURN ━━
Are you watching the $24.96–$25.53 zone on Honda? This was the highest-ranked setup in today's 308-symbol full-market scan. Drop your target below.
Educational analysis based on supply/demand methodology. Not financial advice. Always use proper risk management.  Long
Long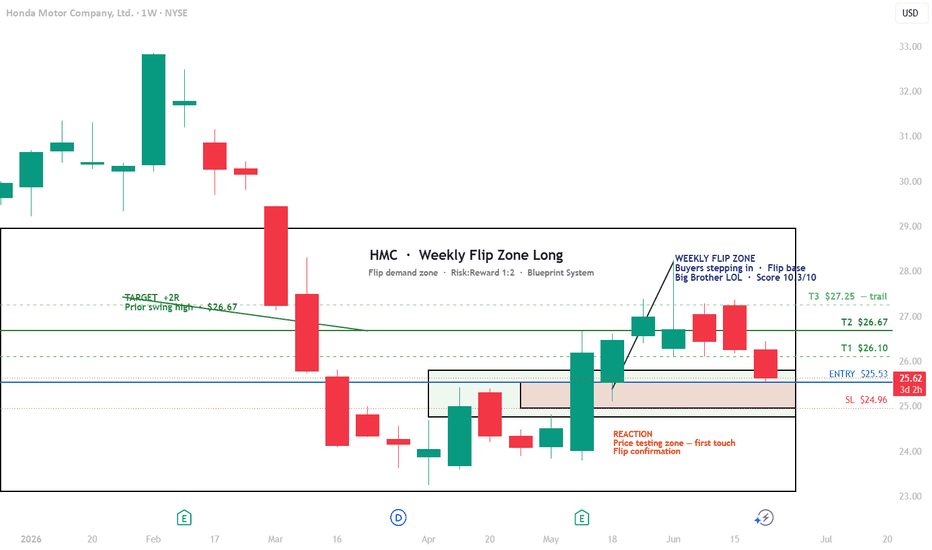
 Long
Long
 Long
Long
XRP – Waiting for the Next ImpulseXRP has been bullish, trading within the rising blue wedge and consistently respecting its upward structure. 📈
After the latest rally, price entered a correction phase and is now approaching an important confluence zone.
Currently, XRP is retesting the lower bound of the blue wedge, which intersects with a strong demand zone marked in green.
This combination of dynamic support and horizontal demand creates an area where buyers may step back into the market.
As long as this intersection holds, we will be looking for longs. 🐂
However, while the broader structure remains bullish, the correction is not fully over yet.
For the bulls to confirm control and start the next impulse movement, a break above the red channel is needed.
Such a breakout would signal that the correction has ended and that momentum is shifting back in favor of the buyers.
Will XRP use this demand zone as a launchpad for the next bullish leg? 🚀
⚠️ Disclaimer: This is not financial advice. Always do your own research and manage risk properly.
📚 Stick to your trading plan regarding entries, risk, and management.
Good luck! 🍀
All Strategies Are Good; If Managed Properly!
~Richard Nasr  Long
Long
Long 
XAUUSD Daily Analysis Bullish Market Structure with Liquidity This is the 1D (Daily) chart of XAUUSD, sourced from FOREX.com via TradingView, with the current price trading at 4,344.07, up by +35.41 (+0.82%) on the day.
The chart reflects a clean bullish market structure on the daily timeframe, confirmed by a clear sequence of higher highs (HH) and higher lows (HL). The overall bias remains firmly BULLISH as price continues to trade above key support zones.
Key technical levels and concepts marked on the chart:
· Liquidity Taken: Price has recently swept sell-side liquidity, indicating that stop-losses below previous lows were triggered, often a precursor to continued upside momentum.
· Demand Order Block (Buyers' Zone): FX:XAUUSD 4,050 – 4,200 – a strong accumulation area where institutional buying has previously emerged. This zone now acts as a critical support base.
· Fair Value Gap (FVG): An imbalance area visible near current price levels, which could act as a magnet or provide support/resistance depending on price reaction.
· Bearish Order Block (Sellers' Zone): 4,650 – 4,750 – a near-term resistance area where selling pressure is likely to emerge.
· Supply Order Block (Major Resistance): 5,100 – 5,300 – the ultimate upside hurdle, representing a large supply zone where aggressive selling is expected.
With price holding above the demand order block and bullish structure intact, the path of least resistance remains to the upside. However, the bearish order block at 4,650–4,750 is the first major test for buyers. A clean breakout above that level could open the door toward the 5,100–5,300 supply zone. Conversely, a break below 4,050 would invalidate the bullish structure and shift the bias to neutral or bearish.
Traders should watch for price reactions around these order blocks and FVG for potential high-probability trade setups. Long 
 Long
Long