BTCUSD: Structure Cracked — Bearish Above EMA200SmartFlow SMC Daily Cross-Asset Analysis — May 4
BTC's full bullish alignment lasted just 3 days. Structure has flipped Bearish after the rejection from the $80,000 level, but price remains $112 above EMA200 ($78,793). The conflict state is back.
Key Observations:
The push to $80,000 was met with aggressive selling, creating a clear structural break. The BoS labels on the way down from $79,800 to $78,700 confirmed the bearish shift. An MSS↓ label is visible at the structural break point near $79,000.
This is a mirror image of BTC's Apr 24 conflict (also Bearish/Above) — which eventually resolved fully bearish before the May 1 bullish reversal. BTC has been the most volatile oscillator in the group, completing a full bearish→bullish→bearish structure cycle in under two weeks.
The EMA200 gap is just $112 — a thin margin. Price is testing right near the line.
Watch for: a break below $78,793 (EMA200) would create full bearish alignment. A reclaim above $79,800 would flip structure back bullish.
Cross-Asset Context:
All four structures are Bearish — the broadest bearish consensus since this tracking period began. BTC and NAS are still above their EMA200s, holding the last thread of conflict.
| Asset | EMA200 | Structure | Status |
| XAUUSD | Below | Bearish | 🔴 Aligned Bearish |
| BTCUSD | Above | Bearish | ⚠️ Conflict |
| EURUSD | Below | Bearish | 🔴 Aligned Bearish |
| NAS100 | Above | Bearish | ⚠️ Conflict |
Not financial advice. For educational purposes only.  Short
Short
 Long
Long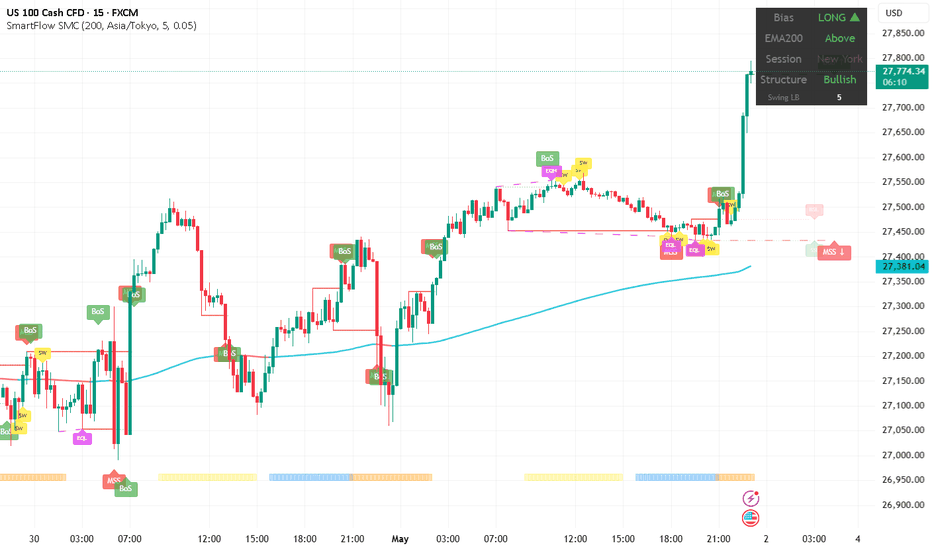
BTCUSD: Full 180 — From Aligned Bearish to Aligned BullishSmartFlow SMC Daily Cross-Asset Analysis — May 1
BTC has completed the most dramatic reversal in this tracking period. On Apr 24 it was fully aligned bearish (Bearish + Below EMA200). Today it's fully aligned bullish (Bullish + Above EMA200) — a complete 180-degree flip.
Key Observations:
The rally from $74,800 to $78,238 was structural. Multiple BoS labels confirmed the bullish trend on the way up, with a clear MSS label marking the original shift point. Price now sits +$1,539 above EMA200 ($76,699) — the widest bullish margin of any asset today.
The surge above $77,800 into new local highs came with strong momentum. An MSS↓ candidate is visible near $77,000 — that's the level bulls need to defend for continuation.
Watch for: a sustained hold above $78,000 for continuation toward $79K+. The MSS↓ at $77,000 is the line in the sand.
Cross-Asset Context:
BTC's full reversal is the headline story. When risk assets complete a full alignment flip within days, it typically signals a regime change in sentiment. Three of four assets are now fully aligned bullish.
| Asset | EMA200 | Structure | Status |
| XAUUSD | Above | Bearish | ⚠️ Conflict |
| BTCUSD | Above | Bullish | ✅ Aligned Bullish |
| EURUSD | Above | Bullish | ✅ Aligned Bullish |
| NAS100 | Above | Bullish | ✅ Aligned Bullish |
Not financial advice. For educational purposes only. Long 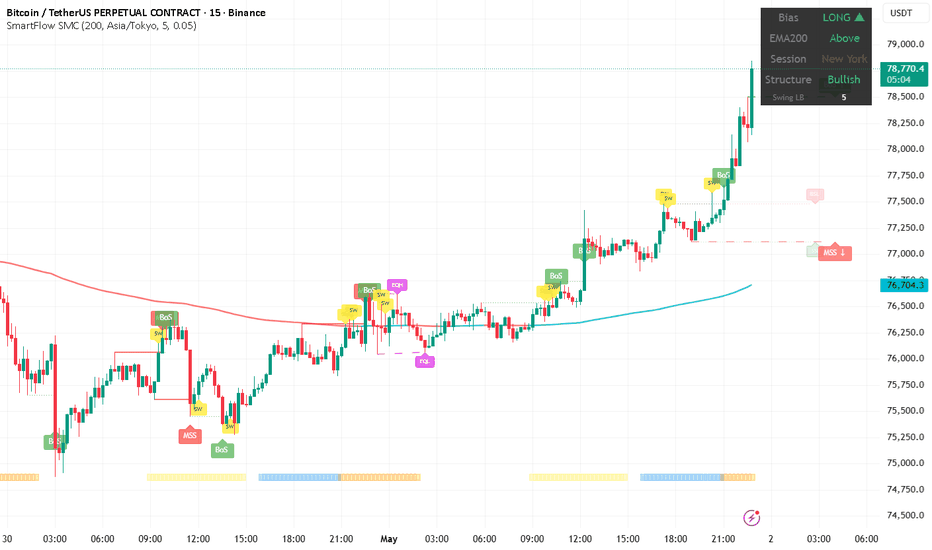
XAUUSD: The Lone Holdout — Bearish Above EMA200SmartFlow SMC Daily Cross-Asset Analysis — May 1
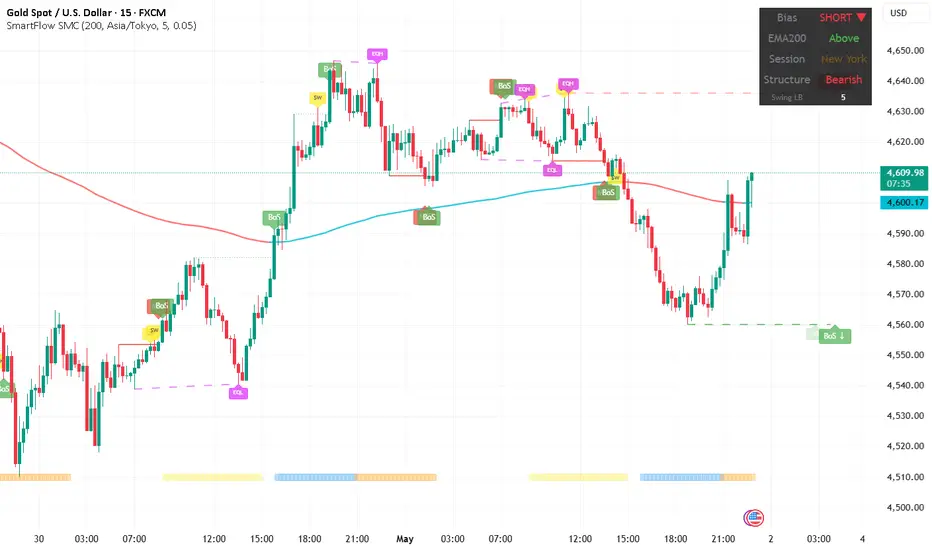
Gold is the only asset not fully aligned bullish — and it's showing a fascinating conflict. Price sits just $5 above the EMA200 ($4,600), but structure is Bearish after a clean rejection from the $4,640 zone. The BoS confirmations on the way down from $4,640 to $4,560 were textbook, followed by a bounce back above EMA200 that hasn't yet flipped structure.
Key Observations:
On Apr 24, Gold's conflict was Bullish/Below — the opposite of today's Bearish/Above. The conflict type itself has rotated 180 degrees. Price resolved the EMA200 side (now Above), but structure flipped bearish in the process. Gold can't seem to get both signals pointing the same direction.
The $4,640 rejection created clear EQH liquidity that was swept and rejected. Below, the $4,560 level with the dashed green FVG zone is acting as the structural floor.
Watch for: a structural flip back to Bullish (needs a higher high above recent swing) to join the other three in full bullish alignment. A break below $4,560 would resolve the conflict bearish instead.
Cross-Asset Context:
Three of four assets are now fully aligned bullish — the strongest bullish consensus since this tracking period began 8+ weeks ago. BTC completed a full 180 from aligned bearish to aligned bullish. EUR finally broke above its EMA200. Gold is the sole holdout.
| Asset | EMA200 | Structure | Status |
| XAUUSD | Above | Bearish | ⚠️ Conflict |
| BTCUSD | Above | Bullish | ✅ Aligned Bullish |
| EURUSD | Above | Bullish | ✅ Aligned Bullish |
| NAS100 | Above | Bullish | ✅ Aligned Bullish |
Not financial advice. For educational purposes only.  Short
Short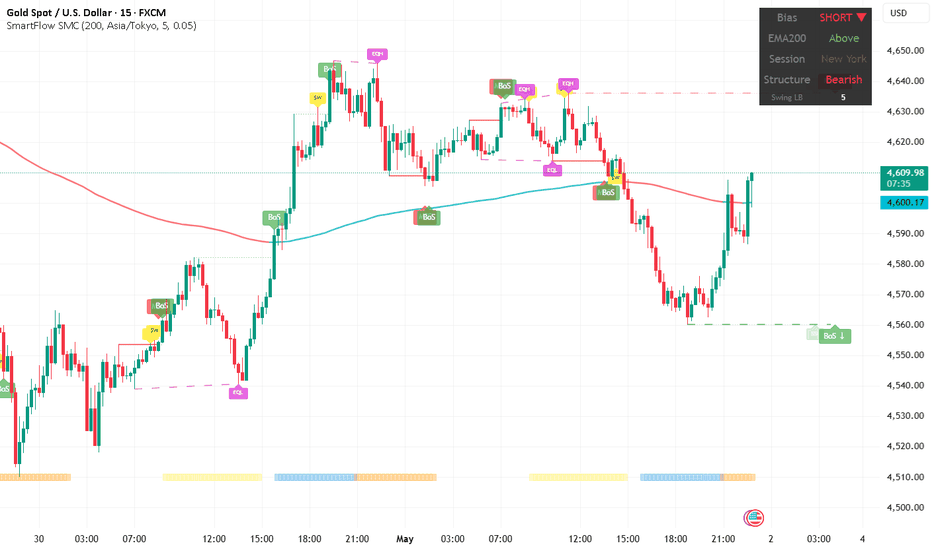
Long 
Short 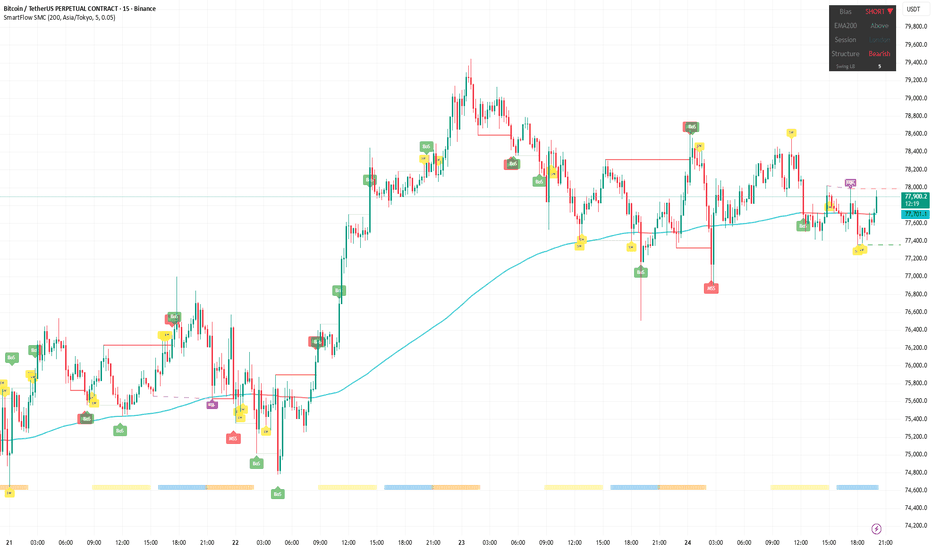
XAUUSD: Bullish Structure Below EMA200 — Conflict ContinuesSmartFlow SMC Daily Cross-Asset Analysis — Apr 24
Gold continues its conflict signal. Structure is Bullish after a BoS confirmation, but price sits $33 below the EMA200 at $4,712. The V-shape recovery from the $4,660 low shows demand stepping in, but sellers are defending the EMA200 zone aggressively.
Key Observations:
After yesterday's historic all-four-in-conflict reading, Gold remains unresolved. The bullish structure suggests dip-buying interest is alive, but staying below EMA200 means the broader trend hasn't confirmed the shift.
Watch for: a close above $4,712 (EMA200) to resolve the conflict bullish. A break below $4,660 would flip structure bearish and create full bearish alignment.
Cross-Asset Context:
Yesterday all 4 assets were in conflict — a first in 7+ weeks of tracking. Today, 2 resolved but in opposite directions: BTC went full bearish, NAS went full bullish. Gold and EUR remain stuck in Bullish/Below conflict. The market is splitting, not aligning.
| Asset | EMA200 | Structure | Status |
| XAUUSD | Below | Bullish | ⚠️ Conflict |
| BTCUSD | Below | Bearish | 🔴 Aligned Bearish |
| EURUSD | Below | Bullish | ⚠️ Conflict |
| NAS100 | Above | Bullish | ✅ Aligned Bullish |
Not financial advice. For educational purposes only. Long 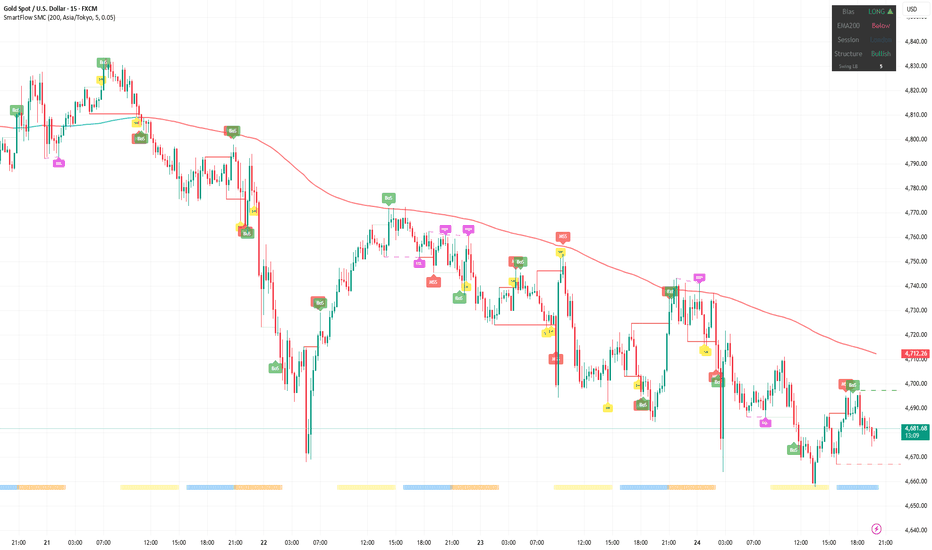
XAUUSD: Conflict Signal at $4,720 — Bullish Below EMA200█ STRUCTURE
Gold at $4,720 with LONG/Below/Bullish. The conflict signal persists — bullish structure fighting below EMA200 ($4,744). Price is $24 below.
Another sharp drop-and-recovery cycle: price fell from $4,810 to $4,690 before staging a V-shape recovery to $4,720. MSS and BoS labels show the structural flip back to bullish during the recovery, but EMA200 remains overhead.
This is the pattern gold has been stuck in for over a week — drop below EMA200, flip bullish on the recovery, attempt to reclaim, fail, drop again. Each cycle's high is lower than the last ($4,860 → $4,830 → $4,810 → $4,770). The trend of lower highs continues despite the bullish structure on 15min.
█ KEY LEVELS
Resistance: $4,744 (EMA200 — must reclaim)
Resistance: $4,760-4,770 (previous cycle high)
Support: $4,700 (BoS zone)
Below: $4,690 (today's low) / $4,670 (Apr 22 low)
█ WHAT TO WATCH
The pattern is clear: lower highs on each EMA200 test while the lows remain in the $4,670-4,700 range. This compression is building toward a resolution — either a decisive reclaim above $4,744 or a break below the $4,670 support floor.
Not financial advice. For educational purposes only. NAS100: Bullish but Thin — $26,668 Just $48 Above EMA200█ STRUCTURE
NAS100 at $26,668 with LONG/Above/Bullish. NAS maintains its bullish stance but the margin above EMA200 ($26,620) has shrunk to just $48 — the thinnest in weeks. MSS labels and volatile BoS patterns on the right side show the bulls are fighting to hold.
The chart tells a choppy story: $26,780 high → sharp drop → MSS → recovery → BoS → another drop. The whipsaw pattern suggests NAS is losing the clean trend character it maintained throughout April. EMA200 is rising fast and approaching price from below.
█ KEY LEVELS
Resistance: $26,700-26,740 (recent BoS / EQH zone)
Resistance: $26,780 (swing high)
Support: $26,620 (EMA200 — $48 below, immediate)
Below: $26,540 / $26,480 (BoS zones)
█ CROSS-ASSET SCORECARD
XAUUSD: ⚠️ LONG / Below / Bullish — $4,752 (V-shape from $4,670, $18 below EMA)
BTCUSD: ✅ LONG / Above / Bullish — $77,936 (clear leader, +$1,757 above EMA)
EURUSD: ⚠️ LONG / Below / Bullish — 1.1749 (recovering, 10 pips below EMA)
NAS100: ✅ LONG / Above / Bullish — $26,668 (bullish but thin, +$48 above EMA)
All four structures are bullish for the first time since Apr 14 — but the quality varies enormously. BTC is surging. NAS is barely holding. Gold and EUR are below their EMA200s. This is "all bullish" on paper but fragile underneath.
The divergence between BTC's dominance (+$1,757 above EMA) and the other three's struggles (Gold -$18, EUR -10pips, NAS +$48) is the widest of this tracking period. BTC is leading — the question is whether the others follow up or BTC eventually catches down.
Not financial advice. For educational purposes only. Long 
XAUUSD: V-Shape Recovery from $4,670 — Conflict at $4,752█ STRUCTURE
Gold at $4,752 with LONG/Below/Bullish. The conflict signal is back — bullish structure below EMA200 ($4,770). But the story today is the V-shape recovery.
Price crashed from $4,810 to below $4,670 — a $140 drop — before staging a sharp recovery with bullish BoS stacking all the way back to $4,752. The recovery shows real buying interest at the lows, with BoS confirmed at $4,700, $4,730, and now pushing $4,750.
EMA200 has dropped to $4,770, and price is $18 below it. The bullish structure is fighting to reclaim it. This is the same "Below but Bullish" pattern that has appeared multiple times — and it has resolved with a reclaim every time so far.
█ KEY LEVELS
Resistance: $4,770 (EMA200 — must reclaim)
Resistance: $4,790-4,800 (previous range)
Support: $4,730 (recent BoS zone)
Below: $4,700 / $4,670 (today's low)
█ WHAT TO WATCH
The V-shape from $4,670 to $4,752 shows demand is still alive below EMA200. But the pattern of lower highs on the EMA200 tests ($4,860 → $4,830 → $4,810 → now approaching from $4,752) suggests diminishing recovery strength. A reclaim of $4,770 would break this pattern. A failure here would be a more serious structural breakdown.
Not financial advice. For educational purposes only.
NETFLIX - Buy The Dip: Confluence Support HoldingNFLX - CURRENT PRICE : 91.82
Netflix is showing a constructive pullback into a confluence support zone, where price is retracing toward the EMA 50 while simultaneously testing the gap-up demand area. The retracement is also holding near the Fibonacci 38.2% golden ratio, which typically acts as a healthy correction within a developing rebound structure. This combination suggests selling pressure is fading and buyers are stepping in at higher levels, increasing the probability of a continuation move.
Momentum-wise, RSI has cooled from overbought levels and is stabilizing above midline, indicating pullback rather than trend breakdown. As long as price holds above the support cluster, the structure remains bullish for a move higher.
Technical Levels
Buy on weakness / near current zone
Target 1: 99 USD (EMA 200 test) 🎯
Target 2: 108 USD (next resistance zone) 🚀
Support / Invalidation: 86 USD
Risk-Reward: Attractive, with limited downside to 86 vs upside toward 99–108
Overall, the pullback into EMA50 + gap support + 38.2% Fibonacci creates a high-probability technical buy setup, favoring a rebound toward the EMA200 first, followed by a continuation to 108 if momentum builds.  Long
Long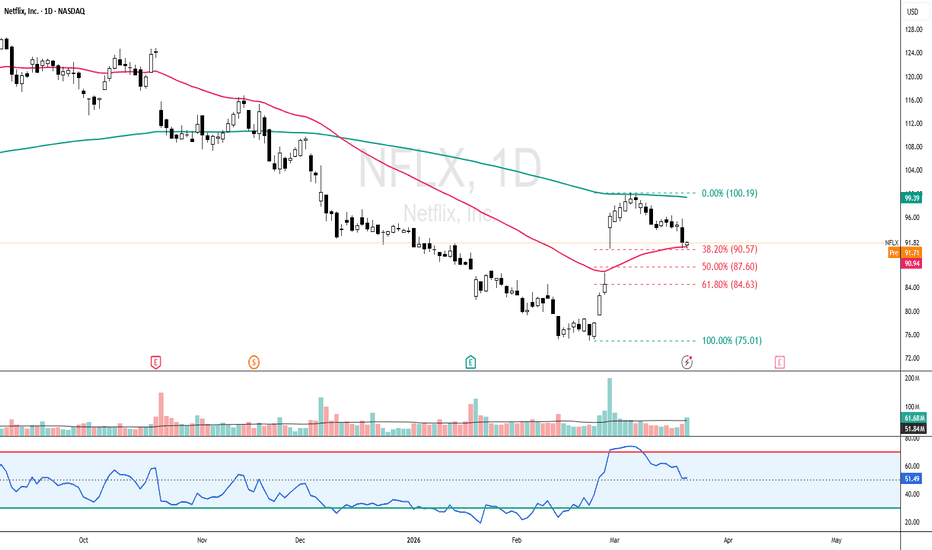
XAUUSD: Below EMA200 but Bullish Again — $4,786 in Conflict█ STRUCTURE
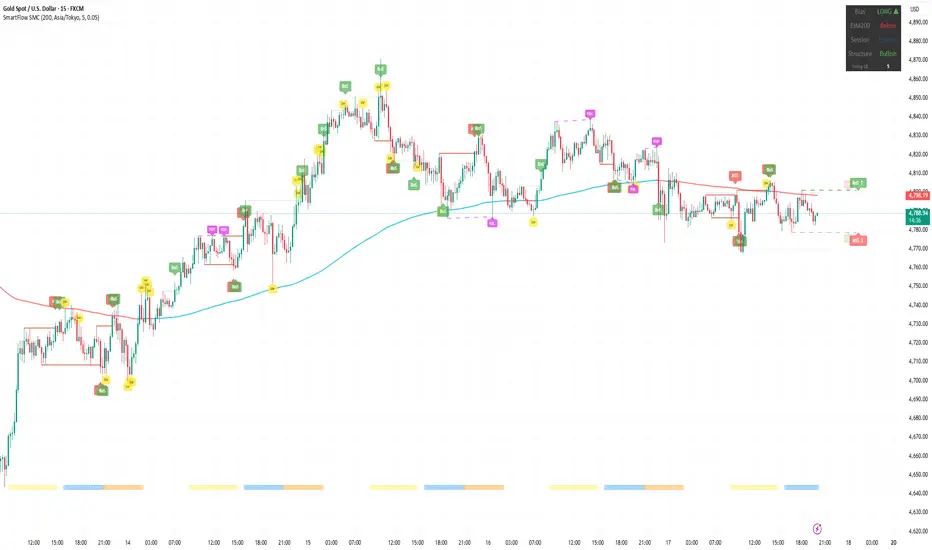
Gold at $4,786 with LONG/Below/Bullish. The conflict signal returns. Structure has flipped back bullish with MSS↑ confirmed and BoS↑ printing, but price remains below EMA200 ($4,798) — $12 short of reclaiming it.
This is the same pattern from Apr 13: bullish structure below EMA200. Last time it resolved with a bullish reclaim. The chart shows the pullback from $4,860 → $4,770 lows → recovery with bullish BoS stacking through $4,780, $4,790, now testing $4,800.
The MSS at $4,800 area marked the structural flip and the BoS↑ label at the right edge shows buyers pushing. EMA200 is the gatekeeper.
█ KEY LEVELS
Resistance: $4,798 (EMA200 — must reclaim)
Resistance: $4,810-4,820 (previous BoS zone)
Support: $4,780 (recent MSS area)
Below: $4,770 / $4,760
█ WHAT TO WATCH
Gold's relationship with EMA200 has been the defining theme of this tracking period. Every time it dips below with bullish structure, it eventually reclaims — so far. The $4,798 level is the test. A clean close above flips the reading to full bullish. A rejection here and loss of $4,780 negates the bullish structure.
Not financial advice. For educational purposes only. XAUUSD: Back Above EMA200 — Bullish Reclaim at $4,782 █ STRUCTURE
Gold at $4,782 with LONG/Above/Bullish. The conflict signal from yesterday (Below but Bullish) has resolved — gold reclaimed EMA200 ($4,747) and structure is now fully aligned bullish.
The recovery from last week's $4,660 low has been relentless. Bullish BoS stacking from $4,700 through $4,740, $4,760, and now pushing $4,790. The EMA200 that acted as resistance for multiple sessions has flipped back to support.
Multiple SW labels show active liquidity sweeps, and BoS labels confirm buyers are in control during London session. Price is $36 above EMA200 — the most comfortable margin since the selloff began.
█ KEY LEVELS
Resistance: $4,790-4,800 (current push zone / previous BoS area)
Target: $4,820-4,840 (gap fill from Apr 10 selloff)
Support: $4,747 (EMA200 — now reclaimed)
Below: $4,730 / $4,700
█ WHAT TO WATCH
The EMA200 reclaim is the key event. Yesterday I noted that the "Below but Bullish" signal resolves in one of two ways — today it resolved bullish. The $4,800 level is the next test. A clean break opens $4,840+. A rejection sets up another EMA200 test.
Not financial advice. For educational purposes only. Long 
NAS100: Holding Bullish Above EMA200 — $25,004 vs $24,972█ STRUCTURE
NAS100 at $25,004 with LONG/Above/Bullish. NAS continues to outperform relative to the group, maintaining bullish structure above EMA200 ($24,972) with a $32 cushion.
After the volatile week — $25,280 high → pullback to $24,800 → recovery — NAS has stabilized above EMA200. The BoS labels on the right side confirm bullish structure is intact, though the margin is thin. Multiple EQH clusters around $25,100-25,200 show resistance above.
█ KEY LEVELS
Resistance: $25,100-25,200 (EQH / BoS cluster)
Resistance: $25,280 (swing high)
Support: $24,972 (EMA200)
Below: $24,900 / $24,800
█ CROSS-ASSET SCORECARD
XAUUSD: ⚠️ LONG / Below / Bullish — $4,720 (conflict: bullish structure, below EMA200)
BTCUSD: 🔴 SHORT / Below / Bearish — $70,739 (full bearish alignment — weakest)
EURUSD: ✅ LONG / Above / Bullish — 1.1693 (bullish but only 4 pips above EMA200)
NAS100: ✅ LONG / Above / Bullish — $25,004 (bullish, $32 above EMA200)
The group is fragmenting. BTC has fully broken down with the first Below + Bearish alignment in this tracking period. Gold is in conflict territory (bullish structure but below EMA200). EUR is barely holding above. NAS is the relative outperformer but the margin is thin everywhere.
All four assets are clustered within striking distance of their EMA200 — this compression usually precedes a decisive directional move.
Not financial advice. For educational purposes only. Long 
XAUUSD: Bullish Structure Below EMA200 — Conflict at $4,720█ STRUCTURE
Gold at $4,720 with LONG/Below/Bullish. This is a conflict signal — structure has flipped back bullish but price sits below EMA200 ($4,736). The indicator is reading bullish BoS on the recovery from recent lows, but the EMA200 overhead is now resistance.
The chart tells a volatile week: $4,870 high on Apr 8 → selloff to $4,640 → recovery attempts with bullish BoS stacking → current price oscillating around EMA200. Multiple SW labels and EQH clusters show heavy two-way activity.
Price briefly reclaimed EMA200 on Apr 11 around $4,800, then lost it again with a sharp drop to $4,660 before this latest recovery.
█ KEY LEVELS
Resistance: $4,736 (EMA200 — overhead, must reclaim)
Resistance: $4,760-4,780 (BoS zone / EQH)
Support: $4,700 (recent BoS support)
Below: $4,660 (Apr 11 low)
█ WHAT TO WATCH
The "Below but Bullish" reading is unstable — it resolves in one of two ways. Either gold reclaims EMA200 at $4,736 and the bullish structure gets confirmed, or the failure to reclaim flips structure bearish again. This is the third EMA200 test in a week. The more times a level is tested, the more likely it breaks — in either direction.
Not financial advice. For educational purposes only. XAUUSD: Structure Flipped Bearish — $4,757 Still Above EMA200█ STRUCTURE
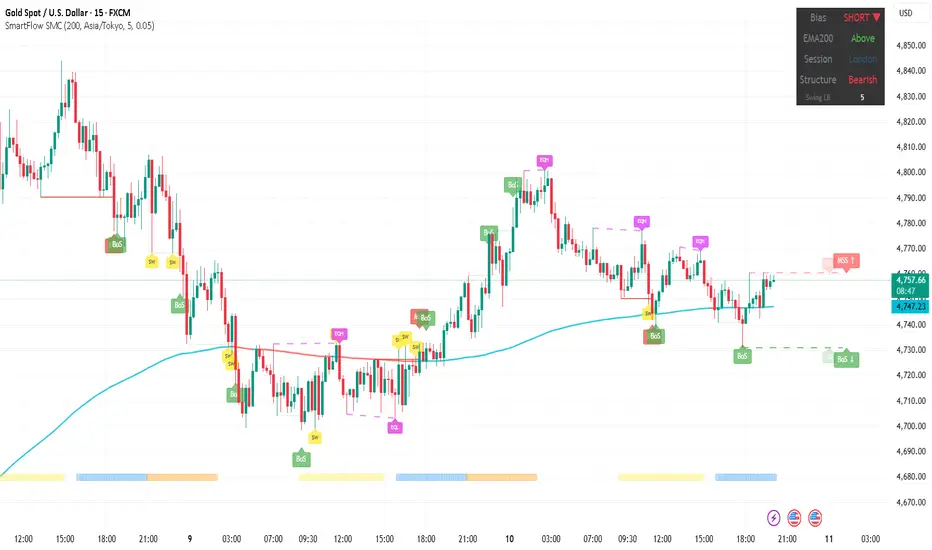
Gold at $4,757 with SHORT/Above/Bearish. A significant change from yesterday's bullish reading. The structure has flipped bearish while price remains above EMA200 ($4,747) — this "Above but Bearish" conflict signal is the same pattern NAS100 showed yesterday.
After yesterday's $4,870 high, the selloff deepened through $4,780 and triggered a bearish structure shift. Multiple BoS labels confirm the downtrend on 15min. Price is now sitting just $10 above EMA200 — extremely tight.
The chart shows a clear sequence: BoS down from $4,800 → failed recovery attempts around $4,780 → continued lower highs → current BoS below $4,740 area.
█ KEY LEVELS
Resistance: $4,780 (recent BoS zone, EQH cluster)
Support: $4,747 (EMA200 — immediate)
Below: $4,720 / $4,700
█ WHAT TO WATCH
EMA200 at $4,747 is the line in the sand. Yesterday it was being tested — today the structure has already flipped bearish above it. If EMA200 breaks, it confirms the bearish structure with a clean below + bearish alignment. If it holds and price reclaims $4,780, the bearish flip was a fake-out.
Not financial advice. For educational purposes only. Short 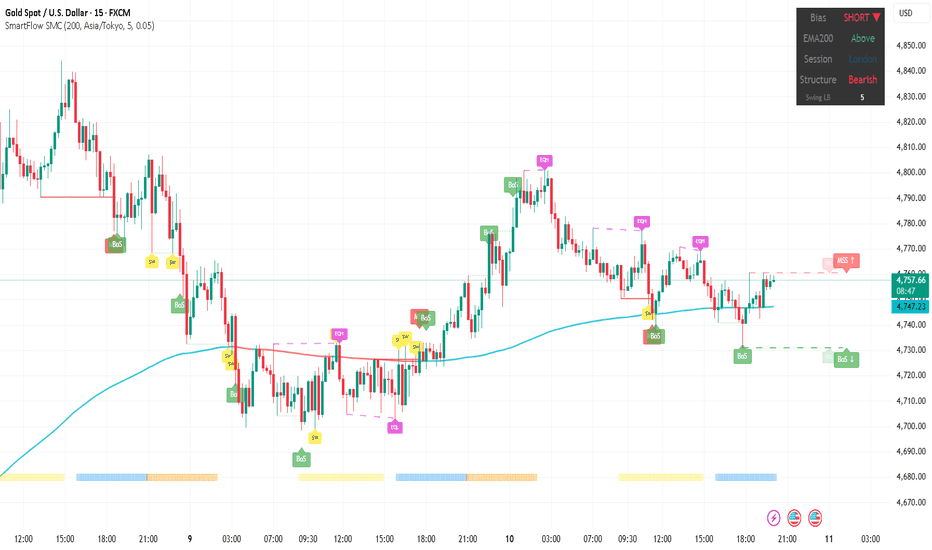
XAUUSD: $4,870 to $4,730 — Testing EMA200 as Support█ STRUCTURE
Gold at $4,730 with LONG/Above/Bullish. After yesterday's spike to $4,870, price has pulled back to the EMA200 zone ($4,725) — a critical test.
The rally from $4,600 was powerful, with bullish BoS stacking all the way up. But the $140 pullback from $4,870 brings price right to EMA200 as support. This is the exact test that defines whether the uptrend continues: EMA200 acted as resistance for weeks, then was reclaimed, and now needs to prove itself as support.
The BoS and SW labels on the right side show the structure is still bullish, with price oscillating around EMA200 during London session.
█ KEY LEVELS
Resistance: $4,780-4,800 (recent BoS zone)
Resistance: $4,870 (yesterday's high)
Support: $4,725 (EMA200 — being tested right now)
Below: $4,700 / $4,680
█ WHAT TO WATCH
This is a textbook EMA200 support test. If $4,725 holds with a bullish BoS → continuation toward $4,800+. If it breaks below → the rally from $4,600 was another failed bounce, and $4,680-4,700 becomes the next support.
The 3-step framework is in Step 3 again: the hold is everything.
Not financial advice. For educational purposes only. Long 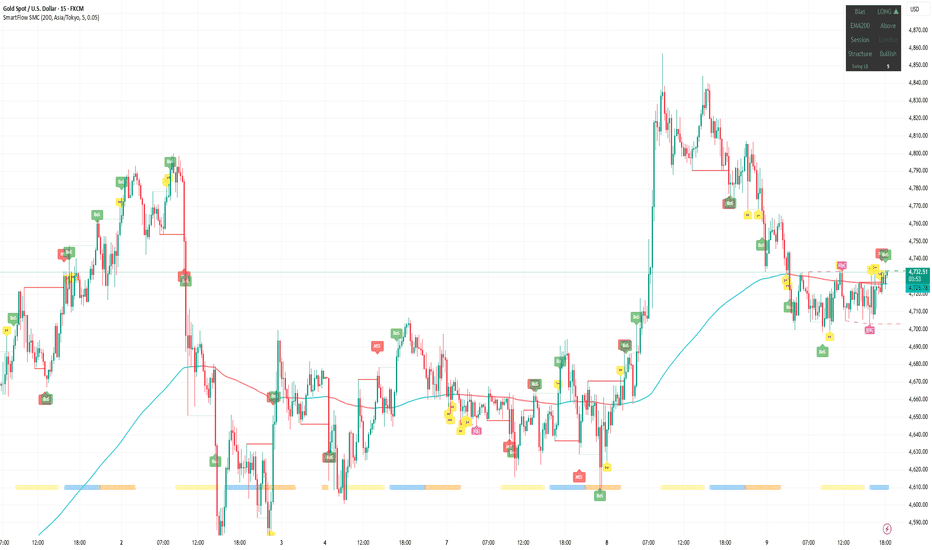

 Short
Short