XAUUSD: V-Shape Recovery from $4,670 — Conflict at $4,752█ STRUCTURE
Gold at $4,752 with LONG/Below/Bullish. The conflict signal is back — bullish structure below EMA200 ($4,770). But the story today is the V-shape recovery.
Price crashed from $4,810 to below $4,670 — a $140 drop — before staging a sharp recovery with bullish BoS stacking all the way back to $4,752. The recovery shows real buying interest at the lows, with BoS confirmed at $4,700, $4,730, and now pushing $4,750.
EMA200 has dropped to $4,770, and price is $18 below it. The bullish structure is fighting to reclaim it. This is the same "Below but Bullish" pattern that has appeared multiple times — and it has resolved with a reclaim every time so far.
█ KEY LEVELS
Resistance: $4,770 (EMA200 — must reclaim)
Resistance: $4,790-4,800 (previous range)
Support: $4,730 (recent BoS zone)
Below: $4,700 / $4,670 (today's low)
█ WHAT TO WATCH
The V-shape from $4,670 to $4,752 shows demand is still alive below EMA200. But the pattern of lower highs on the EMA200 tests ($4,860 → $4,830 → $4,810 → now approaching from $4,752) suggests diminishing recovery strength. A reclaim of $4,770 would break this pattern. A failure here would be a more serious structural breakdown.
Not financial advice. For educational purposes only.
NETFLIX - Buy The Dip: Confluence Support HoldingNFLX - CURRENT PRICE : 91.82
Netflix is showing a constructive pullback into a confluence support zone, where price is retracing toward the EMA 50 while simultaneously testing the gap-up demand area. The retracement is also holding near the Fibonacci 38.2% golden ratio, which typically acts as a healthy correction within a developing rebound structure. This combination suggests selling pressure is fading and buyers are stepping in at higher levels, increasing the probability of a continuation move.
Momentum-wise, RSI has cooled from overbought levels and is stabilizing above midline, indicating pullback rather than trend breakdown. As long as price holds above the support cluster, the structure remains bullish for a move higher.
Technical Levels
Buy on weakness / near current zone
Target 1: 99 USD (EMA 200 test) 🎯
Target 2: 108 USD (next resistance zone) 🚀
Support / Invalidation: 86 USD
Risk-Reward: Attractive, with limited downside to 86 vs upside toward 99–108
Overall, the pullback into EMA50 + gap support + 38.2% Fibonacci creates a high-probability technical buy setup, favoring a rebound toward the EMA200 first, followed by a continuation to 108 if momentum builds.  Long
Long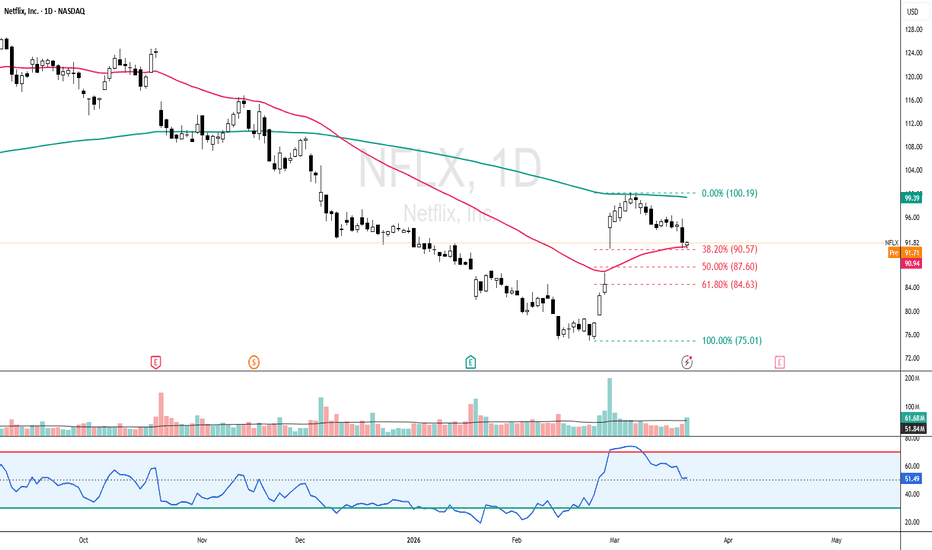
XAUUSD: Below EMA200 but Bullish Again — $4,786 in Conflict█ STRUCTURE
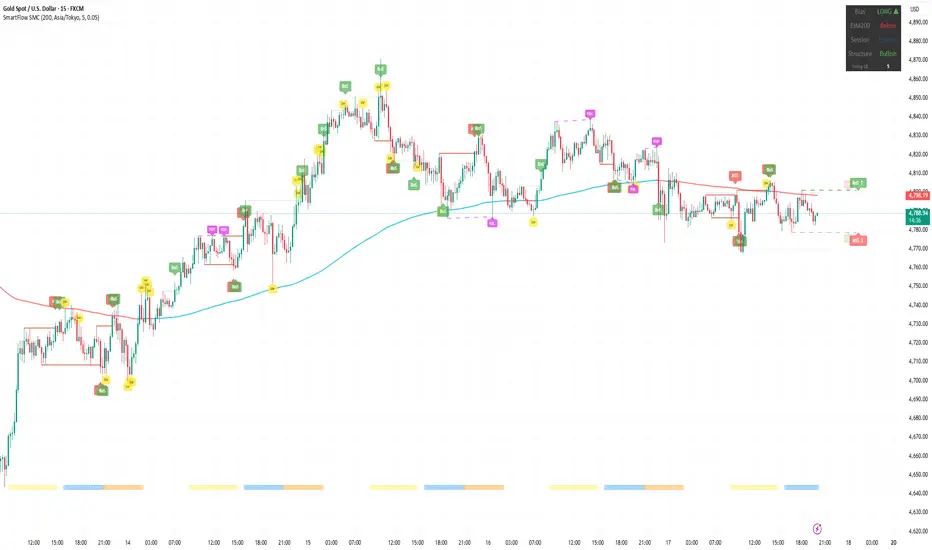
Gold at $4,786 with LONG/Below/Bullish. The conflict signal returns. Structure has flipped back bullish with MSS↑ confirmed and BoS↑ printing, but price remains below EMA200 ($4,798) — $12 short of reclaiming it.
This is the same pattern from Apr 13: bullish structure below EMA200. Last time it resolved with a bullish reclaim. The chart shows the pullback from $4,860 → $4,770 lows → recovery with bullish BoS stacking through $4,780, $4,790, now testing $4,800.
The MSS at $4,800 area marked the structural flip and the BoS↑ label at the right edge shows buyers pushing. EMA200 is the gatekeeper.
█ KEY LEVELS
Resistance: $4,798 (EMA200 — must reclaim)
Resistance: $4,810-4,820 (previous BoS zone)
Support: $4,780 (recent MSS area)
Below: $4,770 / $4,760
█ WHAT TO WATCH
Gold's relationship with EMA200 has been the defining theme of this tracking period. Every time it dips below with bullish structure, it eventually reclaims — so far. The $4,798 level is the test. A clean close above flips the reading to full bullish. A rejection here and loss of $4,780 negates the bullish structure.
Not financial advice. For educational purposes only. XAUUSD: Back Above EMA200 — Bullish Reclaim at $4,782 █ STRUCTURE
Gold at $4,782 with LONG/Above/Bullish. The conflict signal from yesterday (Below but Bullish) has resolved — gold reclaimed EMA200 ($4,747) and structure is now fully aligned bullish.
The recovery from last week's $4,660 low has been relentless. Bullish BoS stacking from $4,700 through $4,740, $4,760, and now pushing $4,790. The EMA200 that acted as resistance for multiple sessions has flipped back to support.
Multiple SW labels show active liquidity sweeps, and BoS labels confirm buyers are in control during London session. Price is $36 above EMA200 — the most comfortable margin since the selloff began.
█ KEY LEVELS
Resistance: $4,790-4,800 (current push zone / previous BoS area)
Target: $4,820-4,840 (gap fill from Apr 10 selloff)
Support: $4,747 (EMA200 — now reclaimed)
Below: $4,730 / $4,700
█ WHAT TO WATCH
The EMA200 reclaim is the key event. Yesterday I noted that the "Below but Bullish" signal resolves in one of two ways — today it resolved bullish. The $4,800 level is the next test. A clean break opens $4,840+. A rejection sets up another EMA200 test.
Not financial advice. For educational purposes only.  Long
Long
NAS100: Holding Bullish Above EMA200 — $25,004 vs $24,972█ STRUCTURE
NAS100 at $25,004 with LONG/Above/Bullish. NAS continues to outperform relative to the group, maintaining bullish structure above EMA200 ($24,972) with a $32 cushion.
After the volatile week — $25,280 high → pullback to $24,800 → recovery — NAS has stabilized above EMA200. The BoS labels on the right side confirm bullish structure is intact, though the margin is thin. Multiple EQH clusters around $25,100-25,200 show resistance above.
█ KEY LEVELS
Resistance: $25,100-25,200 (EQH / BoS cluster)
Resistance: $25,280 (swing high)
Support: $24,972 (EMA200)
Below: $24,900 / $24,800
█ CROSS-ASSET SCORECARD
XAUUSD: ⚠️ LONG / Below / Bullish — $4,720 (conflict: bullish structure, below EMA200)
BTCUSD: 🔴 SHORT / Below / Bearish — $70,739 (full bearish alignment — weakest)
EURUSD: ✅ LONG / Above / Bullish — 1.1693 (bullish but only 4 pips above EMA200)
NAS100: ✅ LONG / Above / Bullish — $25,004 (bullish, $32 above EMA200)
The group is fragmenting. BTC has fully broken down with the first Below + Bearish alignment in this tracking period. Gold is in conflict territory (bullish structure but below EMA200). EUR is barely holding above. NAS is the relative outperformer but the margin is thin everywhere.
All four assets are clustered within striking distance of their EMA200 — this compression usually precedes a decisive directional move.
Not financial advice. For educational purposes only.  Long
Long
XAUUSD: Bullish Structure Below EMA200 — Conflict at $4,720█ STRUCTURE
Gold at $4,720 with LONG/Below/Bullish. This is a conflict signal — structure has flipped back bullish but price sits below EMA200 ($4,736). The indicator is reading bullish BoS on the recovery from recent lows, but the EMA200 overhead is now resistance.
The chart tells a volatile week: $4,870 high on Apr 8 → selloff to $4,640 → recovery attempts with bullish BoS stacking → current price oscillating around EMA200. Multiple SW labels and EQH clusters show heavy two-way activity.
Price briefly reclaimed EMA200 on Apr 11 around $4,800, then lost it again with a sharp drop to $4,660 before this latest recovery.
█ KEY LEVELS
Resistance: $4,736 (EMA200 — overhead, must reclaim)
Resistance: $4,760-4,780 (BoS zone / EQH)
Support: $4,700 (recent BoS support)
Below: $4,660 (Apr 11 low)
█ WHAT TO WATCH
The "Below but Bullish" reading is unstable — it resolves in one of two ways. Either gold reclaims EMA200 at $4,736 and the bullish structure gets confirmed, or the failure to reclaim flips structure bearish again. This is the third EMA200 test in a week. The more times a level is tested, the more likely it breaks — in either direction.
Not financial advice. For educational purposes only. XAUUSD: Structure Flipped Bearish — $4,757 Still Above EMA200█ STRUCTURE
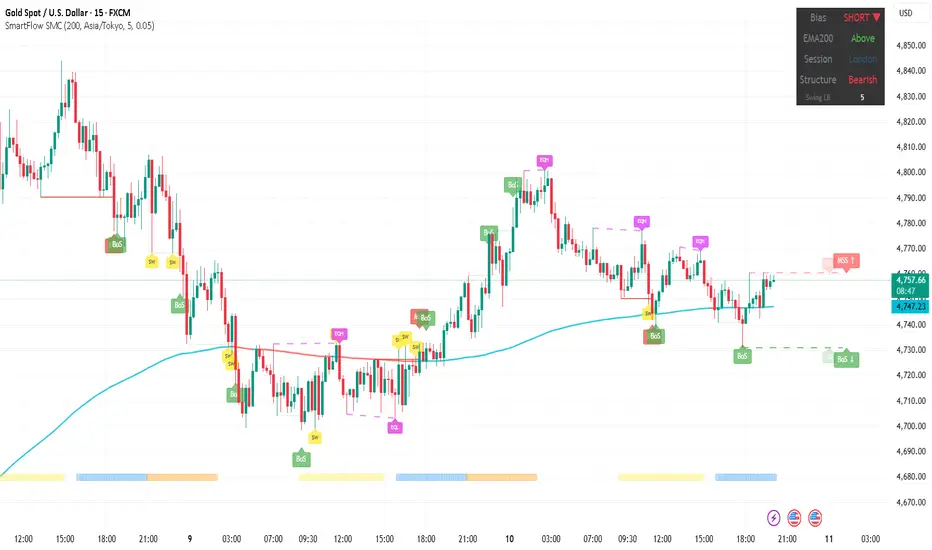
Gold at $4,757 with SHORT/Above/Bearish. A significant change from yesterday's bullish reading. The structure has flipped bearish while price remains above EMA200 ($4,747) — this "Above but Bearish" conflict signal is the same pattern NAS100 showed yesterday.
After yesterday's $4,870 high, the selloff deepened through $4,780 and triggered a bearish structure shift. Multiple BoS labels confirm the downtrend on 15min. Price is now sitting just $10 above EMA200 — extremely tight.
The chart shows a clear sequence: BoS down from $4,800 → failed recovery attempts around $4,780 → continued lower highs → current BoS below $4,740 area.
█ KEY LEVELS
Resistance: $4,780 (recent BoS zone, EQH cluster)
Support: $4,747 (EMA200 — immediate)
Below: $4,720 / $4,700
█ WHAT TO WATCH
EMA200 at $4,747 is the line in the sand. Yesterday it was being tested — today the structure has already flipped bearish above it. If EMA200 breaks, it confirms the bearish structure with a clean below + bearish alignment. If it holds and price reclaims $4,780, the bearish flip was a fake-out.
Not financial advice. For educational purposes only. Short 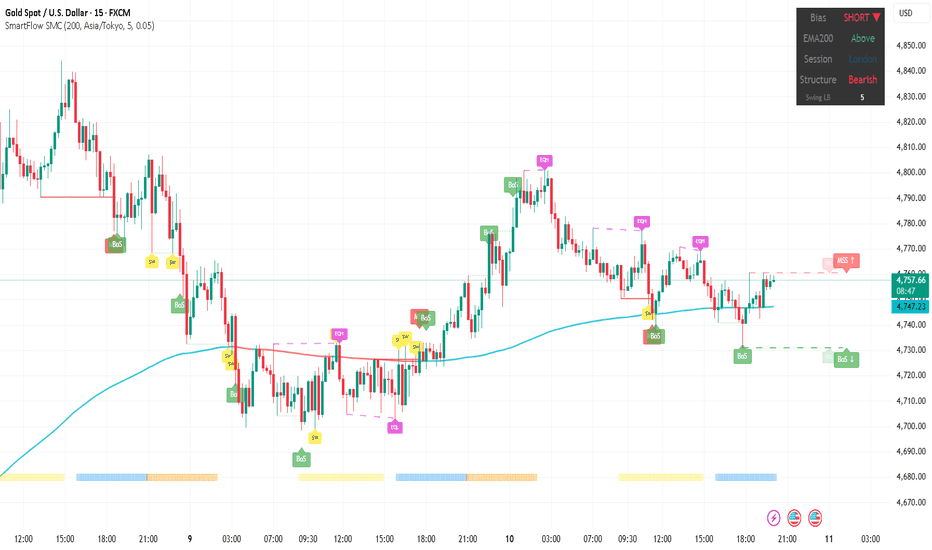
XAUUSD: $4,870 to $4,730 — Testing EMA200 as Support█ STRUCTURE
Gold at $4,730 with LONG/Above/Bullish. After yesterday's spike to $4,870, price has pulled back to the EMA200 zone ($4,725) — a critical test.
The rally from $4,600 was powerful, with bullish BoS stacking all the way up. But the $140 pullback from $4,870 brings price right to EMA200 as support. This is the exact test that defines whether the uptrend continues: EMA200 acted as resistance for weeks, then was reclaimed, and now needs to prove itself as support.
The BoS and SW labels on the right side show the structure is still bullish, with price oscillating around EMA200 during London session.
█ KEY LEVELS
Resistance: $4,780-4,800 (recent BoS zone)
Resistance: $4,870 (yesterday's high)
Support: $4,725 (EMA200 — being tested right now)
Below: $4,700 / $4,680
█ WHAT TO WATCH
This is a textbook EMA200 support test. If $4,725 holds with a bullish BoS → continuation toward $4,800+. If it breaks below → the rally from $4,600 was another failed bounce, and $4,680-4,700 becomes the next support.
The 3-step framework is in Step 3 again: the hold is everything.
Not financial advice. For educational purposes only. Long 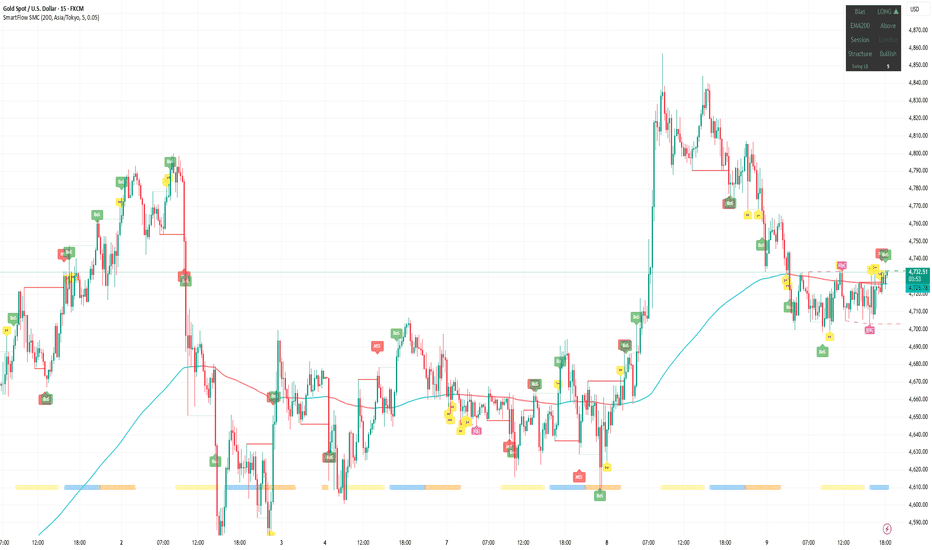
XAUUSD: Back Below EMA200 — $4,760 to $4,621 Overnight█ STRUCTURE
24 hours ago, gold was at $4,760 with a clean bullish structure above EMA200. Today: SHORT/Below/Bearish at $4,621.
The selloff from $4,760 was sharp — bearish BoS confirmed and price dropped back below EMA200 (cyan ~$4,666). An MSS↑ candidate sits on the right edge, suggesting a potential bounce, but the structure has officially flipped bearish again.
This raises a critical question: was the entire $4,350 → $4,760 rally just another failed bounce in the larger downtrend? Or is this a healthy pullback before continuation higher?
The answer lies in where price finds support. The key level is $4,600-4,620 — this is the zone where bullish BoS labels appeared during the rally. If this area holds and a bullish MSS fires, the uptrend could resume. If it breaks, the next support zone is $4,500-4,550.
█ KEY LEVELS
Resistance: $4,666 (EMA200 — back to resistance)
Resistance: $4,700-4,720 (recent BoS zone)
Support: $4,600 (current area / rally BoS zone)
Below: $4,550 / $4,500
█ WHAT TO WATCH
MSS↑ candidate on the right edge — if this fires and price reclaims EMA200 ($4,666), the bull case is alive. If $4,600 breaks instead with bearish BoS → this was another failed bounce like Mar 17 and Mar 20.
The 3-step framework applies: Sweep below $4,600 → bullish MSS → hold above on retest = confirmation.
Not financial advice. For educational purposes only.
XAUUSD: Holding Above EMA200 — But MSS Candidate Lurking█ STRUCTURE
Gold continues to hold above EMA200 — now 4 consecutive days. LONG/Above/Bullish at $4,568 during London session.
The rally from $4,350 to $4,625 earlier today was strong, with bullish BoS stacking all the way up. But the pullback from $4,625 to $4,568 is worth watching — an MSS candidate (↓) has appeared on the right side of the chart, meaning a bearish reversal would trigger if price breaks below the recent swing low.
EMA200 (cyan ~$4,515) is now acting as support for the first time in the entire correction. Price is $50 above it. This is the longest sustained period above EMA200 since the crash began on Mar 13.
█ KEY LEVELS
Resistance: $4,600-4,625 (today's high, recent BoS)
Support: $4,515 (EMA200 — the line that matters)
Support: $4,480-4,500 (previous structure)
MSS trigger: If price breaks below ~$4,540 → structure flips bearish
█ WHAT TO WATCH
The MSS↓ candidate is the key signal to monitor. As long as it remains unbroken, bullish structure holds. A bounce from $4,540-4,550 area with a new bullish BoS would confirm the uptrend.
If the MSS fires and price drops back below EMA200 ($4,515) → back to the familiar pattern of failed bounces.
4 days above EMA200 is the strongest bullish signal since the correction started. The burden of proof has shifted — bears need to prove a reversal, not bulls.
Not financial advice. For educational purposes only. Long 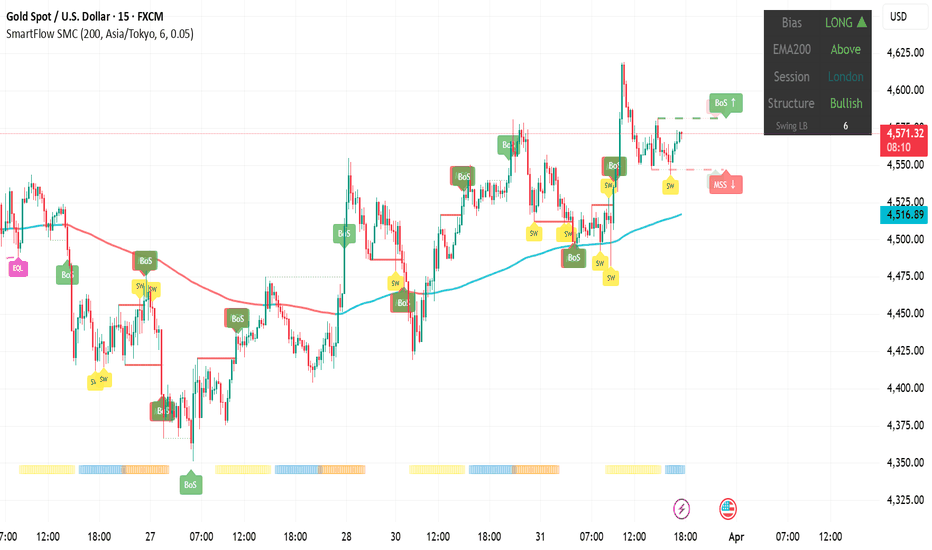
XAUUSD: EMA200 Reclaimed — First Time in 3 Weeks. Is Crash Over?This analysis uses SmartFlow SMC (Free) — auto-detects BoS, MSS, EQH/EQL, BSL/SSL, and Sweeps. No repainting. Community Scripts. Pro version with FVG, OB, OTE, Confluence, and Alerts coming soon.
═══════════════════════════════════════
█ THE MILESTONE
For the first time since the crash began on Mar 13, SmartFlow is showing:
Bias: LONG ▲
EMA200: Above
Structure: Bullish
All three aligned bullish. This hasn't happened in three weeks .
Price is at $4,535, sitting above both EMA200 lines (cyan ~$4,480, red ~$4,460). The 3-step bottom signal that I've been tracking since the start of the crash:
✅ Step 1: Sweep below $4,100 (Mar 23)
✅ Step 2: Bullish MSS confirmed
✅ Step 3: Holding above structure through multiple retests — now above EMA200
This is the first time all three steps have completed since the crash started.
█ WHY THIS IS DIFFERENT
Previous bounce attempts:
Mar 17: MSS at $5,020 → rejected at EMA200 ($5,040) → died in hours
Mar 20: MSS at $4,650 → rejected at EQH ($4,700) → died in hours
Mar 24: MSS at $4,400 → tested EMA200 → held but didn't break above
Today: Price has been consolidating around EMA200 for 4 days ($4,360-$4,560 range) and is now sitting above it. Not a V-shaped spike that gets instantly rejected — a gradual reclaim with structure building.
█ KEY LEVELS
Support: $4,480 (EMA200 — now support, was resistance for 3 weeks)
Support: $4,440-4,460 (EMA200 red + recent BoS zone)
Resistance: $4,560-4,580 (recent highs)
Target: $4,640-4,680 (next structural resistance from Mar 25)
█ WHAT TO WATCH
The critical test now: does EMA200 hold as support on a pullback?
If price pulls back to $4,480 and bounces → EMA200 role reversal confirmed → first genuine recovery signal since the crash.
If price falls back below $4,440 → another failed attempt, back to bearish.
Three weeks of tracking this crash, and this is the most structurally complete bullish setup we've seen. The structure isn't just bullish — it's bullish above the EMA200 for the first time.
Not financial advice. For educational purposes only. Long 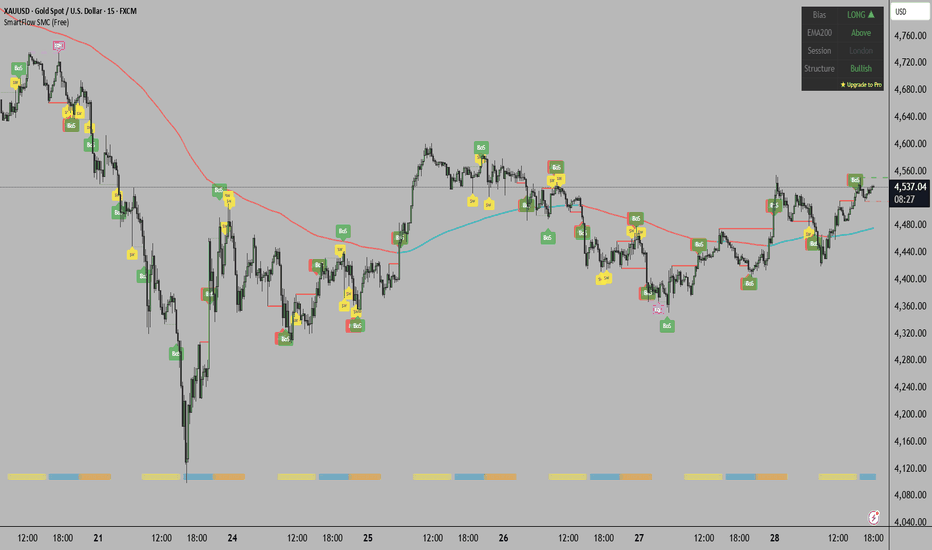
XAUUSD: Bullish Structure at EMA200 — The Retest That Matters
This analysis uses SmartFlow SMC (Free) — auto-detects BoS, MSS, EQH/EQL, BSL/SSL, and Sweeps. No repainting. Community Scripts. Pro version coming soon.
═══════════════════════════════════════
█ STRUCTURE
Something has shifted. SmartFlow shows LONG/Bullish for the first time in days, with price at $4,445 — right at the EMA200 convergence zone.
Price bounced from $4,360 with bullish BoS stacking up. The EMA200 lines (cyan ~$4,480, red ~$4,450) are converging and price is sitting right between them. This is the tightest price-to-EMA200 relationship we've seen since the crash started.
Key difference from previous bounces: price is consolidating at EMA200 instead of getting rejected immediately . Previous attempts ($5,040, $4,700, $4,500) all saw sharp rejections within hours. Today, price is building structure around this level.
█ KEY LEVELS
Resistance: $4,480 (EMA200 cyan — the breakout level)
Resistance: $4,520-4,560 (recent BoS highs from Mar 25-26)
Support: $4,400 (current structure base)
Support: $4,360 (EQL zone — bounce origin)
█ WHAT TO WATCH
This is the 3-step bottom test again:
✅ Sweep below $4,360 — done
✅ Bullish MSS + BoS — done, structure is bullish
⏳ Hold above $4,400 after EMA200 interaction — in progress
If price closes above $4,480 and pulls back to hold $4,400-4,450 → first confirmed structural reversal in 2 weeks. If rejected below $4,400 → same pattern, next leg down.
The fact that structure is bullish while price sits at EMA200 (not $200 below it) is the most constructive setup since the crash began.
Not financial advice. For educational purposes only.  Long
Long
FTAI - Second Opportunity as Trend Structure HoldsFTAI - CURRENT PRICE : 285.75
After the prior technical buy call reached both targets, FTAI is now forming another technically constructive setup worth monitoring. For reference, my previous technical buy call, which successfully hit both targets, is attached in link section.
After the breakout on 30 December 2025, price advanced strongly, followed by a pullback that has reached the 38.2% Fibonacci retracement, which is typical and healthy in strong trends. Price continues to hold above the EMA 50, keeping the medium-term uptrend intact.
Momentum indicators remain supportive of renewed upside. RSI is holding above the 50 level, confirming bullish momentum remains intact, while MACD stays above the zero line with an improving histogram, signaling strengthening upside momentum following the consolidation phase. This combination suggests the pullback has allowed momentum to reset without breaking the broader bullish structure.
ENTRY PRICE : 285.75
FIRST TARGET : 320.00
SECOND TARGET 338.00
SUPPORT : 255.61 (the low of 11 February 2026 candle)
 Long
Long
AER - Ascending Channel & MACD Signal Point to Further UpsideAER - CURRENT PRICE : 150.43
AerCap Holdings N.V. (AER) is currently trading at all-time high levels, which reflects strong bullish momentum and continued demand from buyers. When a stock reaches new highs, it enters a price discovery phase with no historical resistance above, often signaling sustained upward strength.
Technically, price is moving within a well-defined ascending channel , forming higher highs and higher lows — a classic sign of a healthy uptrend. In addition, the stock is trading comfortably above the EMA 50, which is sloping upward, confirming that medium-term momentum remains firmly bullish and that pullbacks are being supported.
Momentum indicators are also turning positive. The MACD is showing a fresh bullish crossover, similar to previous instances highlighted on the chart (look at white circle) where a crossover was followed by a strong price rally. The histogram is turning positive again, suggesting that upside momentum is building at an early stage. If this setup follows the previous pattern, it could lead to another leg higher.
Overall, with price at all-time highs, a strong uptrend channel structure, trading above EMA 50, and an early bullish MACD signal, the technical outlook remains biased toward continued upside.
ENTRY PRICE : 148.00 - 150.43
FIRST TARGET : 163.00
SECOND TARGET : 173.00
SUPPORT : 137.55  Long
Long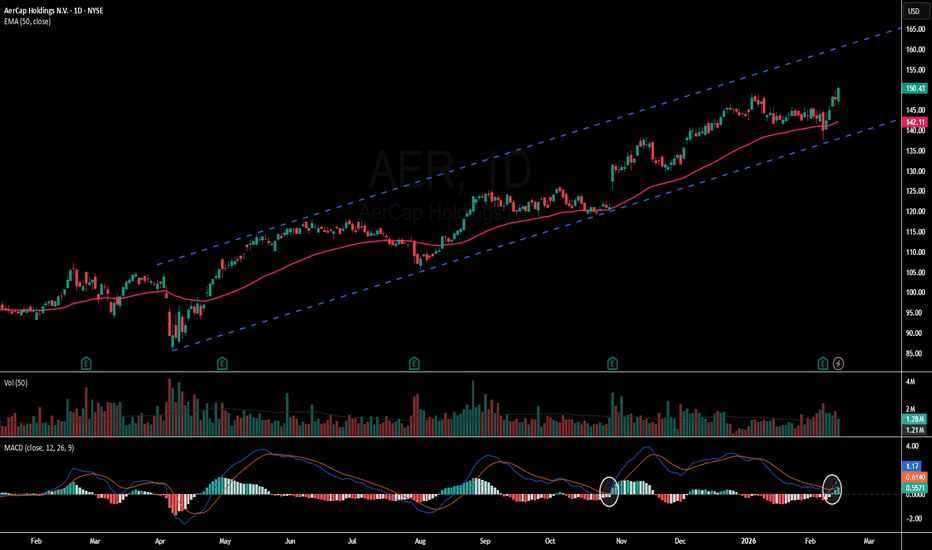
 Long
Long
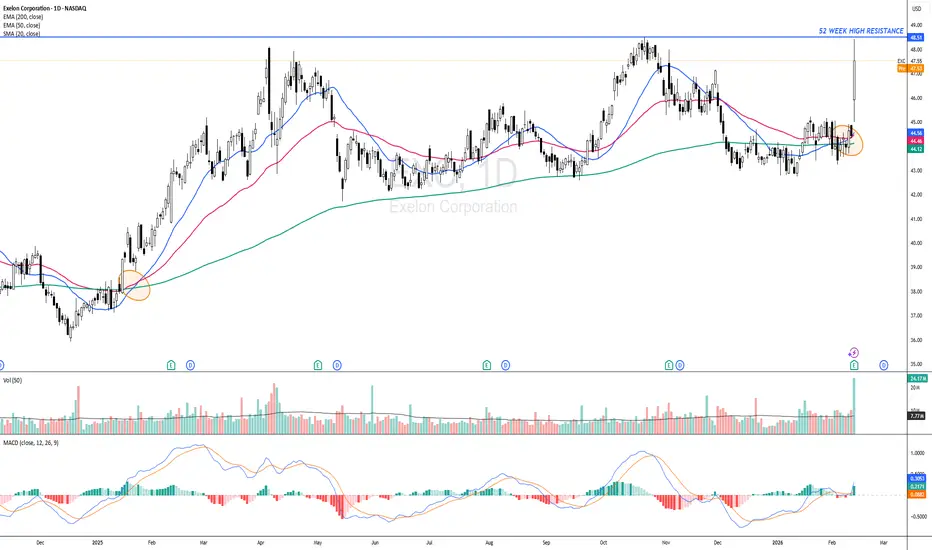
EXC - Positive MA Structure with MACD ConfirmationEXC - CURRENT PRICE : 47.55
Exelon Corp is flashing a bullish moving-average crossover, with SMA 20 crossing above EMA 50 and EMA 200, signalling a positive shift in trend. This setup has occurred before (look at orange circle) and previously led to a strong upside move. Price is holding above key moving averages, maintaining a bullish bias, while MACD remains bullish, confirming improving momentum. Rising volume supports the bullish moving-average crossover, indicating increasing participation from buyers.
ENTRY PRICE : 46.50 - 47.55
FIRST TARGET : 52.00
SECOND TARGET : 57.00
SUPPORT : 42.00
Company profile : Exelon Corp. is a utility services holding company, which engages in the energy distribution and transmission businesses. It operates through the following segments: Commonwealth Edison Company, PECO Energy Company, Baltimore Gas and Electric Company, Potomac Electric Power Company, Delmarva Power and Light Company, and Atlantic City Electric Company. The company was founded on February 4, 1999 and is headquartered in Chicago, IL.  Long
Long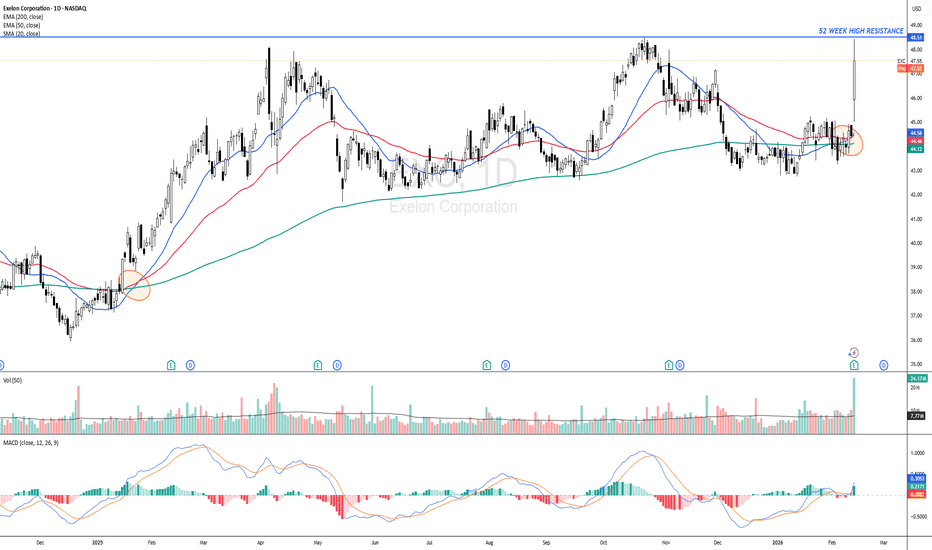
 Long
Long
TVTX - Breaks a 10-Year High – A New Chapter BeginsTVTX - CURRENT PRICE : 38.21
TVTX has made a major technical breakout by moving above its 10-year high at $37.04, a level last seen in August 2015. This move places the stock firmly into price discovery, meaning there is no nearby historical resistance overhead. Importantly, the breakout is holding, with the previous resistance now acting as strong support, a key sign of a healthy and sustainable uptrend.
Looking back, the 24 December breakout can be viewed as an ascending triangle breakout, where price consistently made higher lows before finally pushing above resistance. This pattern often signals strong accumulation and continuation rather than a short-term spike. Trend indicators remain supportive, with price trading above the EMA 50 and above the Ichimoku Cloud, both pointing to a well-established bullish trend.
From a price action perspective, the latest candlestick structure has formed a Bullish Harami based on Japanese candlestick analysis , suggesting selling pressure is fading and buyers may be preparing for the next move higher. As long as TVTX continues to hold above the former resistance zone and the EMA 50 on a daily closing basis, pullbacks are considered buy-on-dip opportunities. The next upside targets are $42 followed by $45, while a daily close below the EMA 50 would invalidate the bullish setup and serves as a cut-loss level.
ENTRY PRICE : 38.21
FIRST TARGET : 42.00
SECOND TARGET : 45.00
SUPPORT : EMA 50 (Cutloss if price closed below EMA 50)  Long
Long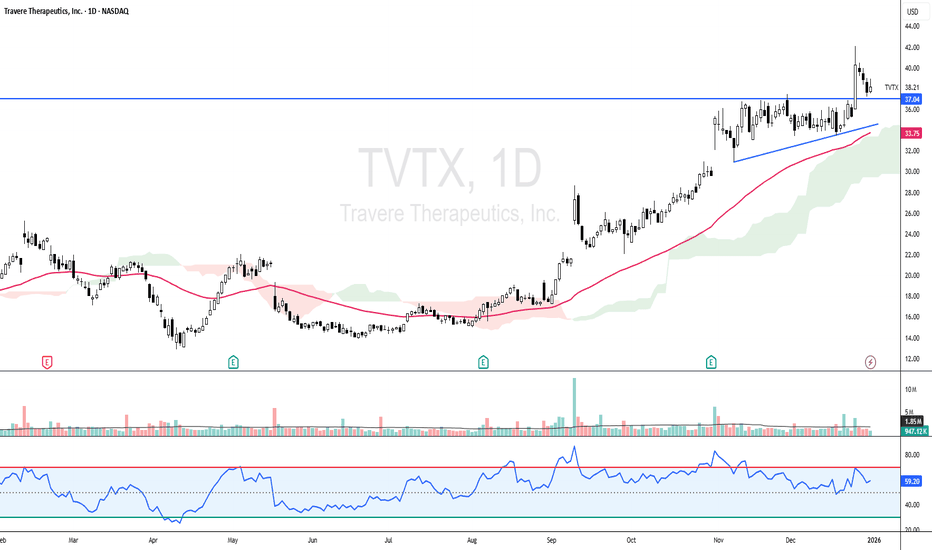
 Long
Long
 Long
Long