XAUUSD: Back Below EMA200 — $4,760 to $4,621 Overnight█ STRUCTURE
24 hours ago, gold was at $4,760 with a clean bullish structure above EMA200. Today: SHORT/Below/Bearish at $4,621.
The selloff from $4,760 was sharp — bearish BoS confirmed and price dropped back below EMA200 (cyan ~$4,666). An MSS↑ candidate sits on the right edge, suggesting a potential bounce, but the structure has officially flipped bearish again.
This raises a critical question: was the entire $4,350 → $4,760 rally just another failed bounce in the larger downtrend? Or i
Exponential Moving Average (EMA)
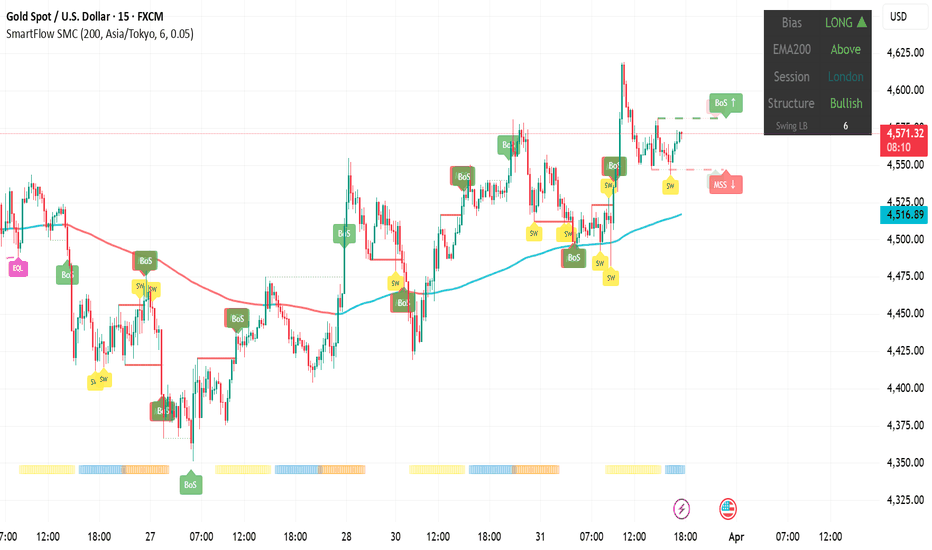
XAUUSD: Holding Above EMA200 — But MSS Candidate Lurking█ STRUCTURE
Gold continues to hold above EMA200 — now 4 consecutive days. LONG/Above/Bullish at $4,568 during London session.
The rally from $4,350 to $4,625 earlier today was strong, with bullish BoS stacking all the way up. But the pullback from $4,625 to $4,568 is worth watching — an MSS candidate (↓) has appeared on the right side of the chart, meaning a bearish reversal would trigger if price breaks below the recent swing low.
EMA200 (cyan ~$4,515) is now acting as support for the fi
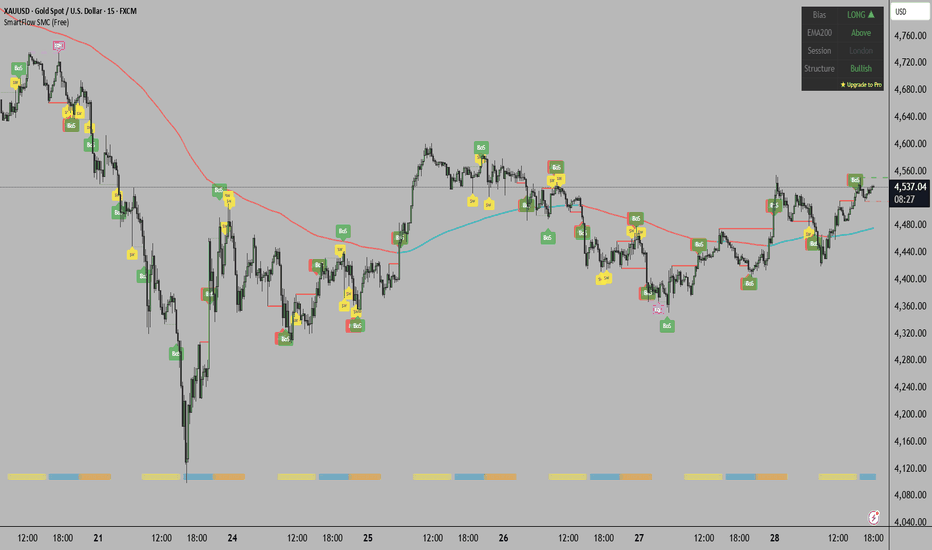
XAUUSD: EMA200 Reclaimed — First Time in 3 Weeks. Is Crash Over?This analysis uses SmartFlow SMC (Free) — auto-detects BoS, MSS, EQH/EQL, BSL/SSL, and Sweeps. No repainting. Community Scripts. Pro version with FVG, OB, OTE, Confluence, and Alerts coming soon.
═══════════════════════════════════════
█ THE MILESTONE
For the first time since the crash began on Mar 13, SmartFlow is showing:
Bias: LONG ▲
EMA200: Above
Structure: Bullish
All three aligned bullish. This hasn't happened in three weeks .
Price is at $4,535, sitting above both
XAUUSD: Bullish Structure at EMA200 — The Retest That Matters
This analysis uses SmartFlow SMC (Free) — auto-detects BoS, MSS, EQH/EQL, BSL/SSL, and Sweeps. No repainting. Community Scripts. Pro version coming soon.
═══════════════════════════════════════
█ STRUCTURE
Something has shifted. SmartFlow shows LONG/Bullish for the first time in days, with price at $4,445 — right at the EMA200 convergence zone.
Price bounced from $4,360 with bullish BoS stacking up. The EMA200 lines (cyan ~$4,480, red ~$4,450) are converging and price is sitting r
NATGATE - 8 RECORD SESSION LOWS ?NATGATE : CURRENT PRICE : RM1.00 - RM1.02
NATGATE has been in a corrective phase and recently printed an 8-session low, which often signals selling exhaustion and opens the door for a technical rebound. (The record session topic is discussed by STEVE NISON in his book - BEYOND CANDLESTICK , PAGE 121 - 127)
A bullish piercing line appeared in Friday’s session, where buyers pushed price well into the prior bearish candle’s body. Stochastic oscillator is currently in the oversold zone, signallin
FTAI - Second Opportunity as Trend Structure HoldsFTAI - CURRENT PRICE : 285.75
After the prior technical buy call reached both targets, FTAI is now forming another technically constructive setup worth monitoring. For reference, my previous technical buy call, which successfully hit both targets, is attached in link section.
After the breakout on 30 December 2025, price advanced strongly, followed by a pullback that has reached the 38.2% Fibonacci retracement, which is typical and healthy in strong trends. Price continues to hold above th
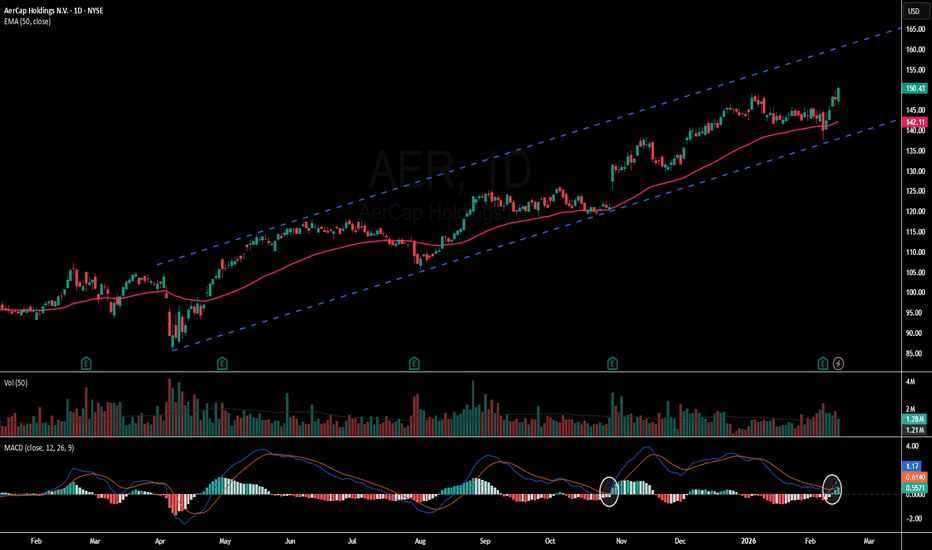
AER - Ascending Channel & MACD Signal Point to Further UpsideAER - CURRENT PRICE : 150.43
AerCap Holdings N.V. (AER) is currently trading at all-time high levels, which reflects strong bullish momentum and continued demand from buyers. When a stock reaches new highs, it enters a price discovery phase with no historical resistance above, often signaling sustained upward strength.
Technically, price is moving within a well-defined ascending channel , forming higher highs and higher lows — a classic sign of a healthy uptrend. In addition, the stock is t
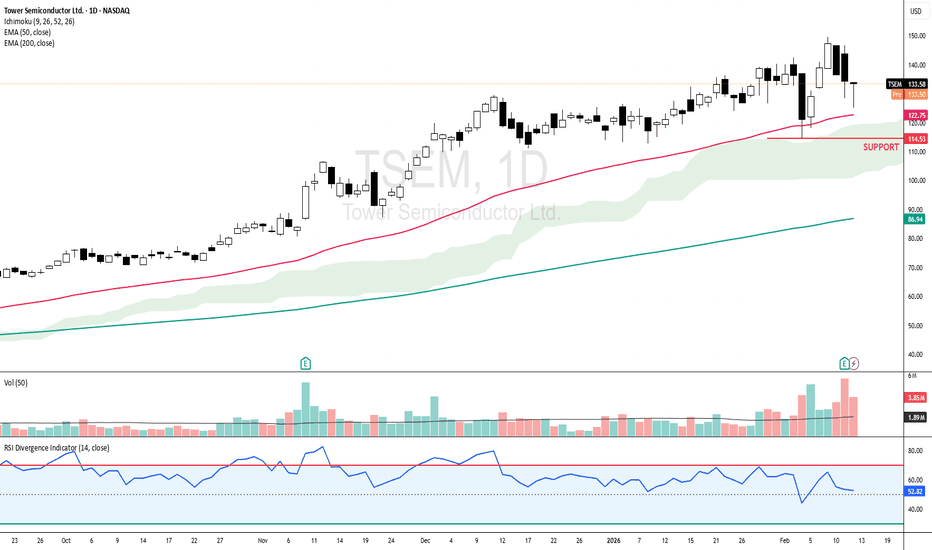
TSEM - Hammer at EMA 50 Confirms Bullish Trend ContinuationTSEM - CURRENT PRICE : 133.58
📈 TSEM – Technical Buy Call (Hammer at EMA 50)
Tower Semiconductor (TSEM) remains in a strong uptrend, with price holding above EMA 200 (long-term bullish) and above EMA 50 (medium-term bullish). The recent hammer candle near EMA 50 signals strong buying interest and rejection of lower prices. Importantly, price has been staying above the Ichimoku Cloud since May 2025, confirming a sustained bullish trend. RSI remains above 50, supporting positive momentum.
Ac
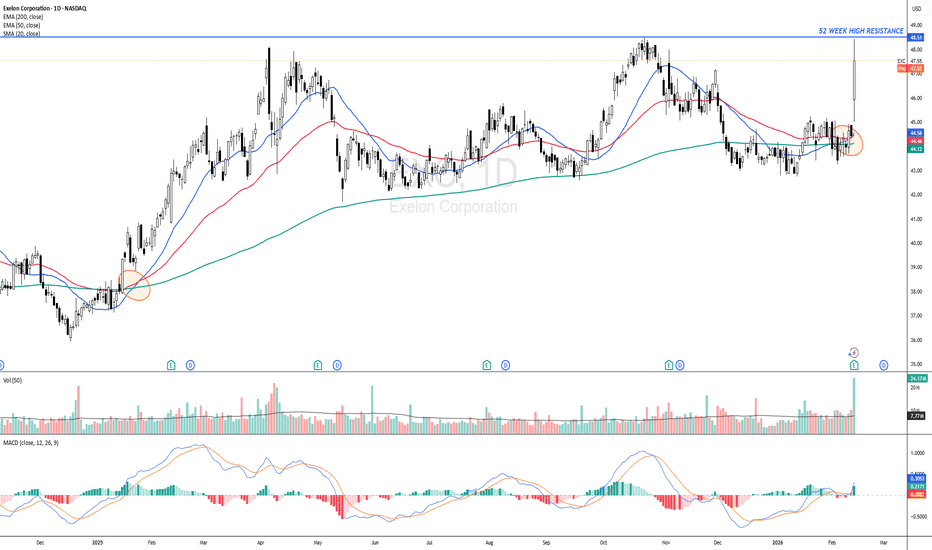
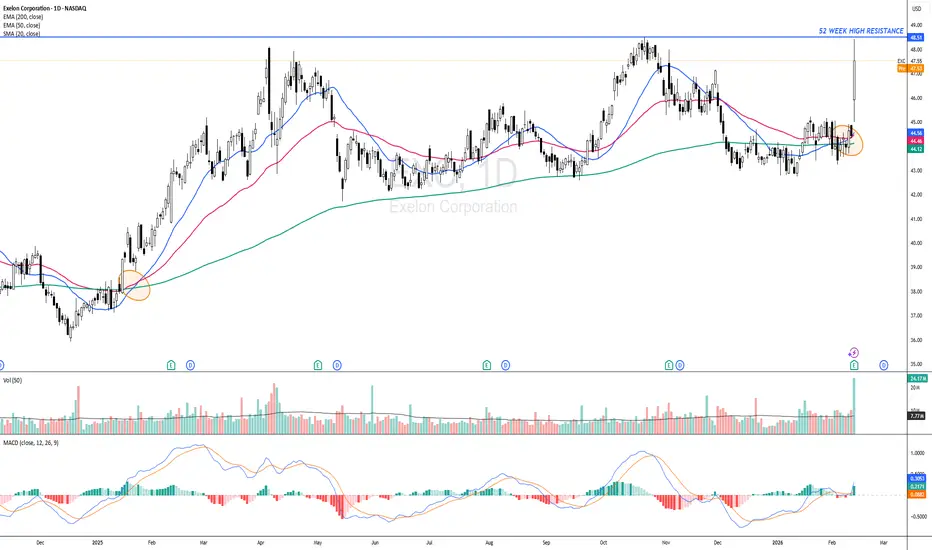
EXC - Positive MA Structure with MACD ConfirmationEXC - CURRENT PRICE : 47.55
Exelon Corp is flashing a bullish moving-average crossover, with SMA 20 crossing above EMA 50 and EMA 200, signalling a positive shift in trend. This setup has occurred before (look at orange circle) and previously led to a strong upside move. Price is holding above key moving averages, maintaining a bullish bias, while MACD remains bullish, confirming improving momentum. Rising volume supports the bullish moving-average crossover, indicating increasing particip
AMAZON - EMA 200: Where Institutions Step InAMZN - CURRENT PRICE : 237.70
📈 AMZN — Institutional Support Holds, Momentum Breakout
AMZN continues to trade in a primary uptrend, with EMA 200 acting as a strong institutional accumulation zone. Multiple pullbacks toward the EMA 200 (highlighted in green) were met with immediate buying interest, confirming long-term demand.
Momentum is now turning bullish:
🔥Price has broken back above the Ichimoku Cloud, signaling trend resumption.
🔥RSI is crossing above the 60 level, a classic sign of bul
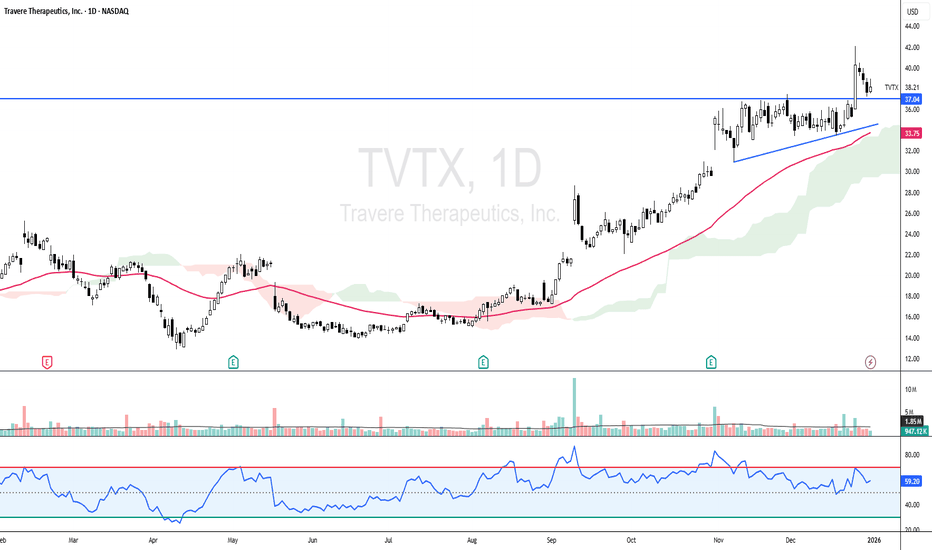
TVTX - Breaks a 10-Year High – A New Chapter BeginsTVTX - CURRENT PRICE : 38.21
TVTX has made a major technical breakout by moving above its 10-year high at $37.04, a level last seen in August 2015. This move places the stock firmly into price discovery, meaning there is no nearby historical resistance overhead. Importantly, the breakout is holding, with the previous resistance now acting as strong support, a key sign of a healthy and sustainable uptrend.
Looking back, the 24 December breakout can be viewed as an ascending triangle breakou
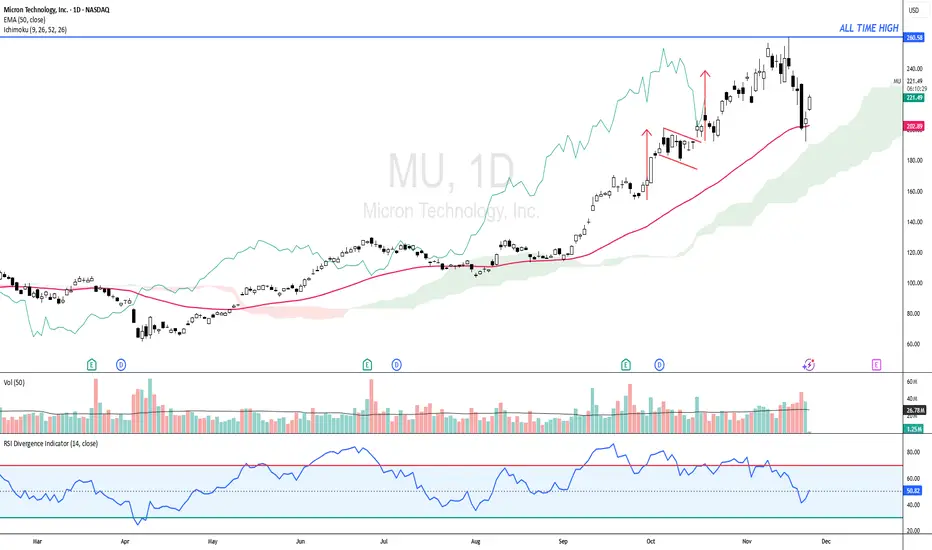
MU – Trend Still Intact, EMA50 Bounce SetupMU - CURRENT PRICE : 220.00 - 222.00
Technical Reasons (Bullish Bias)
1️⃣ Price retesting strong dynamic support
Price is holding above the 50-day EMA, which has acted as support throughout the uptrend. Pullback into EMA50 often forms a bullish continuation point.
2️⃣ Price still above the Ichimoku Cloud
Price is trading above the cloud, meaning long-term trend remains bullish. The cloud is thick — showing strong trend support. Latest pullback is testing the top of the cloud, usually a high-
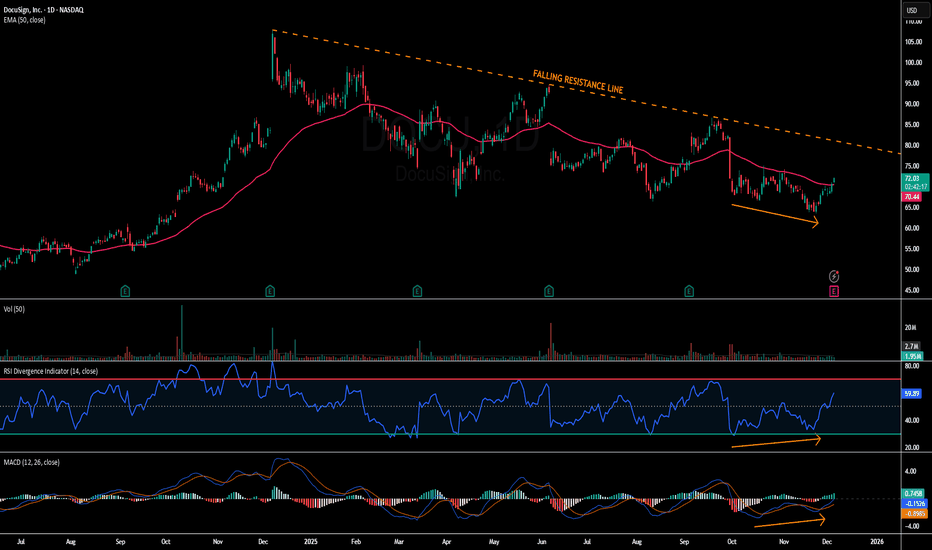
DOCU - Trendline Resistance in FocusDOCU - CURRENT PRICE : 71.87
Short-term outlook for DOCU is bullish as price moves above the EMA50, supported by RSI holding above 50 and bullish divergence in both RSI and MACD (look at orange arrows). Momentum continues to improve with a MACD bullish crossover, positioning DOCU for a move toward the long-term downtrend line. First target is $79 near trendline resistance, with a potential extension to $85, while $65 remains the key support and invalidation level.
ENTRY PRICE : 70.00 - 71.87
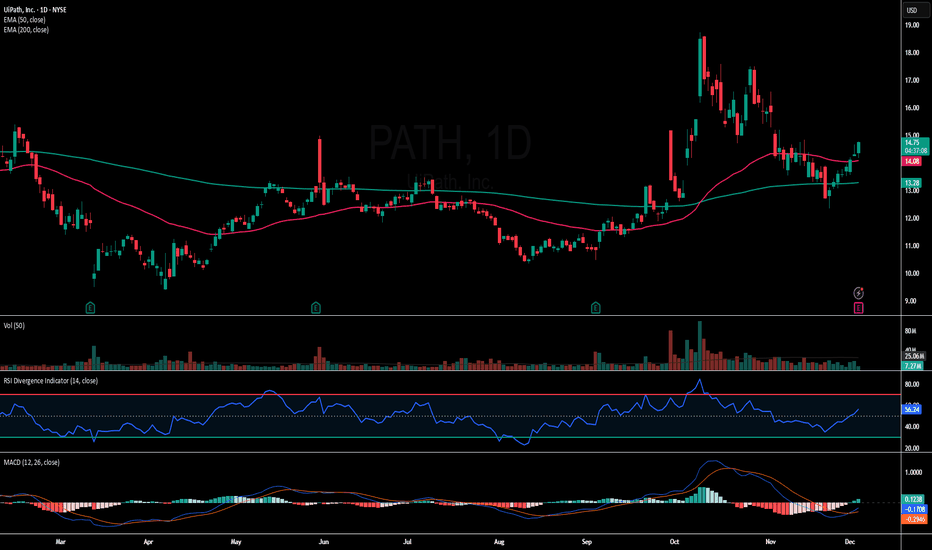
PATH - Price Reclaims 50-EMA and 200-EMAPATH - CURRENT PRICE : 14.50 - 14.70
PATH is gaining traction after reclaiming both the 50-EMA and 200-EMA, signalling a shift back into short-term bullish momentum 📈. Price strength is supported by rising RSI and an improving MACD cross, suggesting buyers are regaining control.
🔥 Bullish Points
Price reclaimed 50-EMA and 200-EMA
RSI trending above 50 → bullish momentum returning
MACD turning positive with increasing histogram
Volume uptick on recent green candles = buyers active
ENTRY
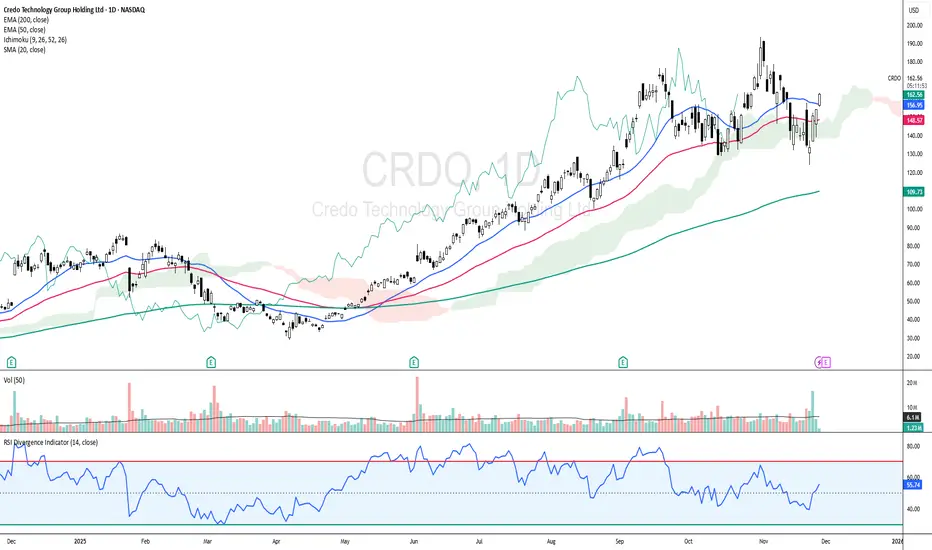
CRDO: Cloud + EMAs Aligning for Upside ContinuationCRDO - CURRENT PRICE : 162.95
CRDO is showing a bullish reversal setup as price rebounds and closes back above the EMA50 while holding firmly above the Ichimoku Cloud , signaling the major trend remains intact. Momentum is improving with RSI rising above 50 and not yet overbought, supported by increasing volume on the recent bullish white candlestick.
Today’s move above the 20-day SMA adds a positive layer to the short-term trend structure. Short term targets are 175.00 and 185.00 while s
btc finds 200 ema support, whats next?As I have been posting in these "Ideas" for the past few weeks about market direction and where the price for BTC will go. It now has come to pass where the 200 EMA has been tested and support has been found, It however has not generated any relief among buyer sentiment unable to push price above the previous days close leaving the digital asset to continue to bleed out and cause positions from all the 93k Bulls to liquidate.
Its a shame people cannot make the connection that the only way
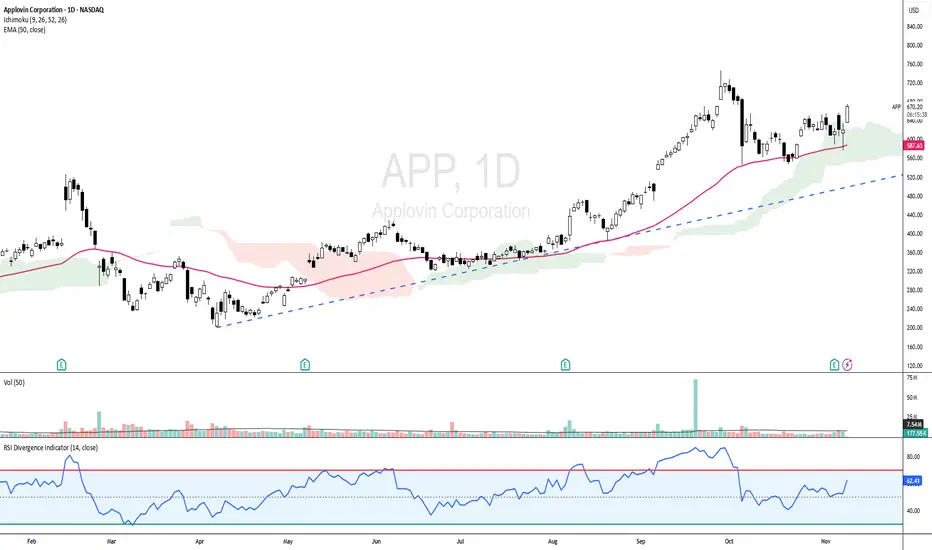
APP - UPTREND STILL INTACT!APP - CURRENT PRICE : 670.00 - 674.00
APP is showing strong bullish momentum as the price trades above the 50-day EMA and ICHIMOKU CLOUD , indicating a sustained uptrend. The RSI is in bullish territory but not yet overbought, indicating room for further upside. With the current setup, the stock has potential to retest its all-time high area if momentum continues.
ENTRY PRICE : 670.00 - 674.00
FIRST TARGET : 727.00
SECOND TARGET : 770.00
SUPPORT : 50-day EMA
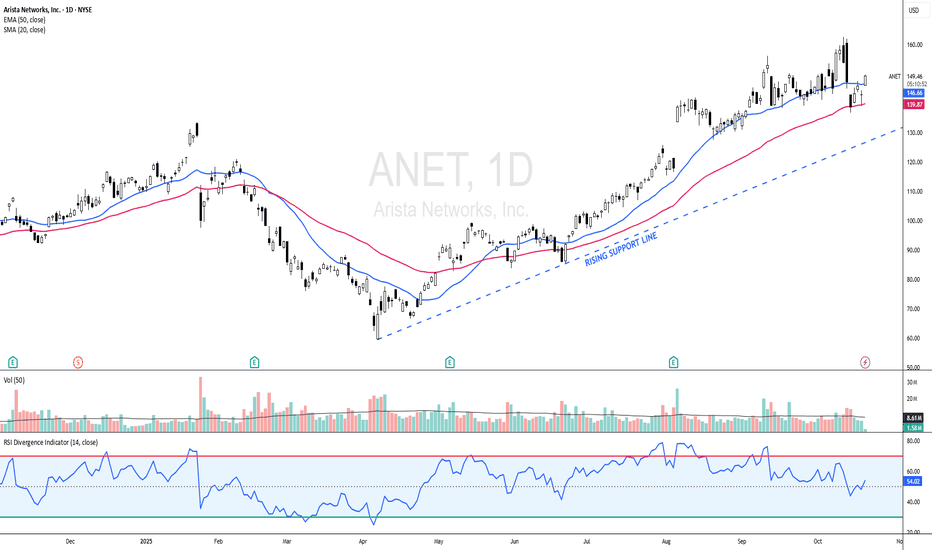
ANET - Rebounds from EMA 50ANET - CURRENT PRICE : 148.00 - 149.00
Technical Rationale:
1. Rebound from Key Moving Average Support
The stock price has rebounded strongly from the 50-day EMA, which has acted as a dynamic support level throughout the uptrend. This rebound indicates renewed buying interest at a technically significant area.
2. Bullish Momentum Confirmation
ANET has crossed above the 20-day SMA, suggesting a short-term shift back to bullish momentum after a healthy pullback. This crossover reflects improvi
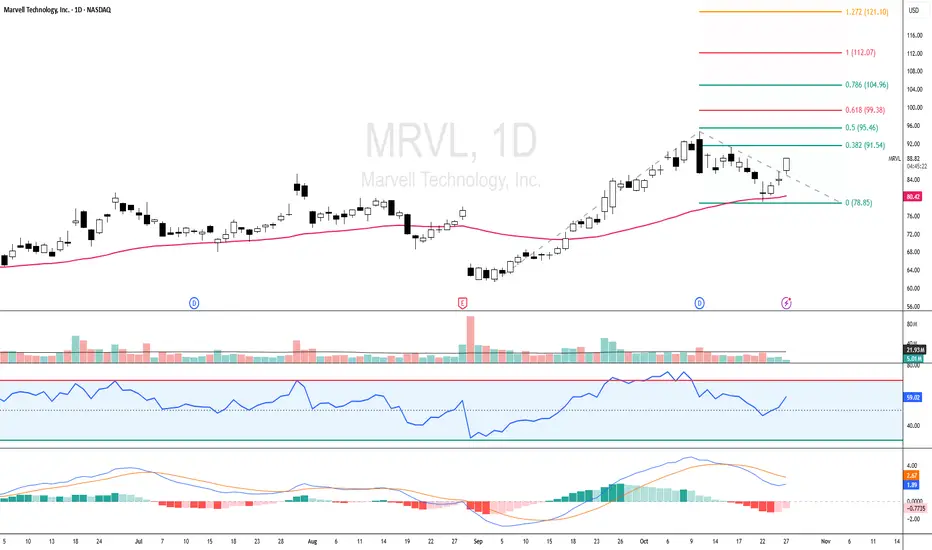
MRVL - RSI Back Above 50, Eyes Fibonacci Targets at 99 and 112MRVL - CURRENT PRICE : 86.00 - 88.00
MRVL is showing early signs of bullish continuation after finding support near the 50-day EMA and rebounding with positive momentum. The price structure remains healthy as it trades above the EMA 50, suggesting the medium-term trend is still intact.
Key Technical Highlights :
1) Price Above EMA 50
The stock price is holding above the EMA 50, showing that the uptrend remains valid and buyers are still in control.
2) RSI Above 50 and Not Overbought
RSI has
DRIFT Breakout Setup – Higher High + Retest in PlayDRIFT is showing strong bullish momentum after months of accumulation. The token has broken out, printed a higher high, and is now retesting the previous range high as support — a classic setup for continuation.
With price hovering near the 21-day EMA, this zone could act as a launchpad if sentiment holds. The structure supports a potential leg higher, making this a high-reward, low-risk opportunity for swing traders.
🔹 Trade Setup
Entry Zone: $0.68 – $0.72
Take Profit Targets:
🥇 $1.02
🥈 $1.2
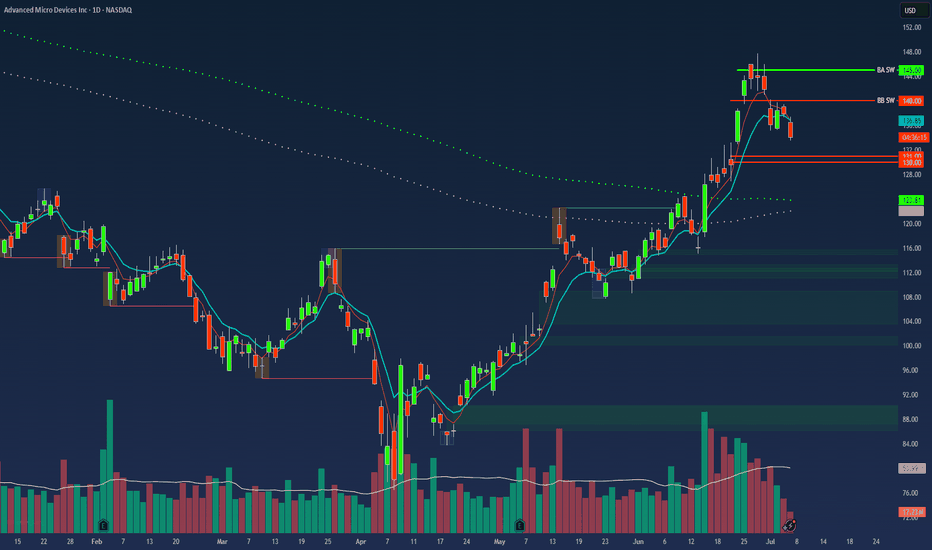
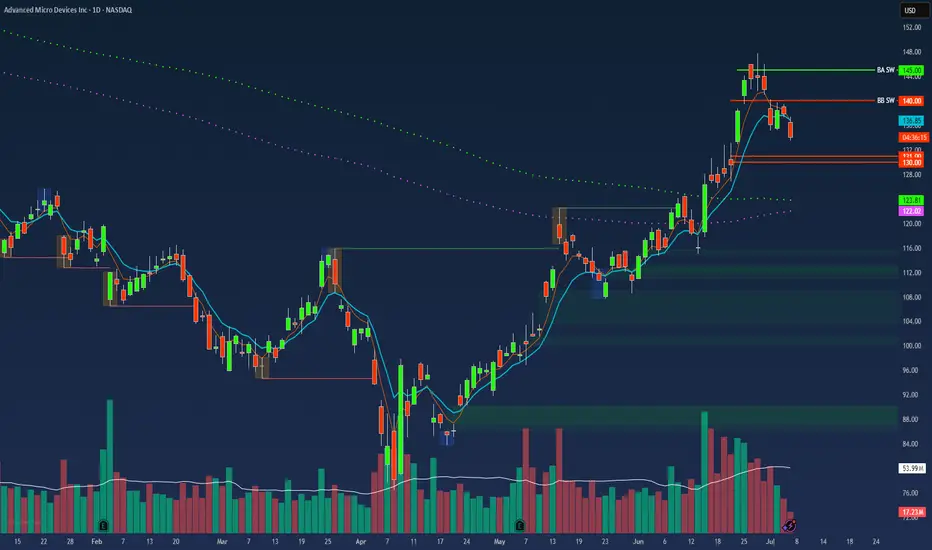
$AMD Swing Trade – Put Debit Spread Setup🔻 NASDAQ:AMD Swing Trade – Put Debit Spread Setup (Jul 18 Exp)
📅 Trade Opened: July 3, 2025
🛠 Strategy: Buy to Open (BTO) Put Debit Spread
📉 Strikes: $31 / $30 (Jul 18 Expiration)
💵 Cost (Premium Paid): $0.21
🎯 Trade Thesis
This setup aims to capture short-term downside in NASDAQ:AMD via a low-cost, defined-risk spread. The trade fits within my broader portfolio of OTM spreads under $0.25.
Key Drivers:
🔻 Semi sector under pressure – NASDAQ:AMD showing relative weakness.
📉 Breakdown bel
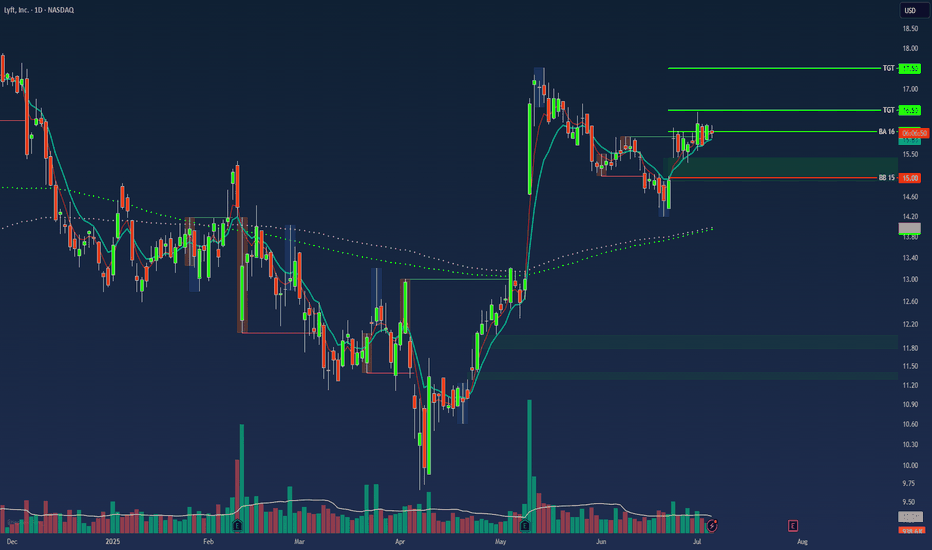
$LYFT Swing Trade – Low-Cost Call Debit Spread Setup🚗 NASDAQ:LYFT Swing Trade – Low-Cost Call Debit Spread Setup (Jul 18 Exp)
📅 Trade Opened: July 3, 2025, 2:53 PM
🛠 Strategy: Buy to Open (BTO) Call Debit Spread
📈 Strikes: $16.5 / $17.5 (Jul 18 Expiration)
💵 Cost (Premium Paid): $0.25
🎯 Trade Thesis
This swing trade targets a short-term bullish move in NASDAQ:LYFT based on improving fundamentals and favorable technical setup. The structure uses a low-cost OTM call spread to define risk and limit exposure while capturing directional potentia