BTC — Bullish Gartley Harmonic PatternBitcoin is setting up for a Bullish Gartley harmonic pattern, with price approaching the Potential Reversal Zone (PRZ) around $81,382.
After the recent move higher, BTC has been consolidating above the PRZ, and this area is where I'm watching for the Gartley to complete and potentially trigger another move higher.
Trade Setup
Entry: $81,382
Stop Loss: $80,415
TP1: $87,324
TP2: $93,830
TP3: $101,500
The $81,382 level is the key area on this chart. If BTC pulls back into the PRZ and holds, I
Fibonacci Confluence
SILVER — Bullish Gartley Harmonic PatternSilver is approaching a very interesting Bullish Gartley harmonic pattern, with price moving into the Potential Reversal Zone (PRZ) around $59–$60.
This is the area I'm watching closely.
Trade Setup
Entry: $59.00–$60.00
TP1: $67.556
TP2: $71.00
TP3: $76.8425
TP4: $86.00
The $59–$60 area is the key PRZ. If the Bullish Gartley completes here and we get confirmation from price action, I believe this could be a very important area for Silver.
What makes this setup especially interesting is the
BROS — Bullish Gartley Harmonic PatternBROS is approaching a major Potential Reversal Zone (PRZ) where the Bullish Gartley pattern is completing.
The chart currently looks ugly. Price has been falling hard, and at first glance this can look like a falling knife. But this is exactly the type of setup I like to watch when a harmonic pattern is completing at a major PRZ.
Trade Setup
Entry: $34–$36
Stop Loss: $26.00
TP1: $56.00
TP2: $70.00
TP3: $88.00
The $34–$36 area is the key PRZ. This is where the Gartley is expected to complete
MSTR: Bullish Gartley With Massive Upside PotentialMSTR has formed a bullish Gartley pattern on the weekly chart, competing around the Potential Reversal Zone.
More importantly, the dashed green trigger has already been triggered, giving the bullish setup confirmation.
Trade Setup
Entry Zone: $110–$120
Stop Loss: $75
Take Profit Targets:
TP1: $305
TP2: $410
TP3: $600
TP4: $900
The Bigger Picture
What stands out here is the potential size of the move.
If MSTR holds the reversal zone and continues higher, the move toward $305 and $410 woul
SUNB — Bullish Gartley SetupSUNB is coming into an area where a Bullish Gartley pattern could give us a nice reversal setup. After the recent selloff, price is now sitting inside the potential reversal zone.
I’m watching two levels closely before considering the setup confirmed.
Confirmation
The yellow trend line is the first one to watch. Price has been respecting this downward trend, so breaking above it would be an early sign that the sellers are losing control.
The second level is the red dotted line at $67.26. Get
ETC: Is This Gartley Setting Up a Reversal?Ethereum Classic is sitting in an interesting spot. We have a bullish Gartley pattern developing near the $7 area, and at the same time, RSI is showing bullish divergence — price is making lower lows while momentum is starting to improve.
But there’s one level I’m watching very closely: the yellow trendline.
That trendline has been acting as a major barrier on the way down. A clean break and hold above the yellow trendline would give this setup much stronger confirmation that the trend may fin
LIGHTER - Trading Setup Case Study and Price TargetsHey, everybody. This is Brett. We're going to do a case study here on Lighter.
Lighter has had quite a run here, coming back since May, down here around a dollar all the way up to $3 there. So if we put the date and price range up, it's about 275% up, which is pretty good.
A couple of things here we're going to kind of unpack at the same time.
Originally, we were watching this and watching a bull flag pattern, and so the bull flag is where you have a flag pole, is the terminology, and then
SPCX: Bearish Sequence Unfolding Toward Downside Target CFollowing the completion of the prior bullish sequence into the overhead target zone near 150.00, NASDAQ:SPCX has shifted market structure to begin a corrective phase. Price action has formed a clear bearish sequence from the highs, defining an initial impulse into Point A followed by a corrective bounce to Point B.
The aggressive breakdown from the upper consolidation confirms active continuation toward the bearish Point C target. This projected target box sits between 125.50 and 129.00, rep
Silver's Bullish Gartley: Reversal Loading?Silver has entered a key Potential Reversal Zone (PRZ) as a Bullish Gartley pattern nears completion. This harmonic setup suggests selling pressure may be fading, creating conditions for a potential trend reversal.
If buyers step in and defend this support area, silver could begin a strong recovery toward higher resistance levels. With a favorable risk-to-reward profile and clearly defined invalidation levels, this is a technical setup worth watching closely.
A confirmed bounce from the PRZ co
BULLISH GARTLEY SETUP DEVELOPING ON DASH/USDDash is on the verge of completing a bullish Gartley pattern on the daily chart.
To keep it simple, this could mark the beginning of the strongest bullish move Dash has seen in years.
Do what you want with this information. I'm simply sharing what I believe is a high-probability setup.
Blue pill or red pill—the choice is yours.
/CL: Bearish Deep Gartley and Bearish Shooting Star Confirmed/CL seems to be furthering it's RSI Bearish Divergence as the price-action prints a Hanging Man followed by a Bearish Shooting Star, confirming an .886 entry for a newly developed Bearish Deep Gartley. This can serve as a good secondary entry against Oil, Market Volatility, and the DXY which may likely lead to a bounce in SPX, BTC, ETH, and perhaps Silver as detailed here:
I will be careful with gold and silver and SPX as those aren't exactly fixed assets not even Gold and Silver. The producti
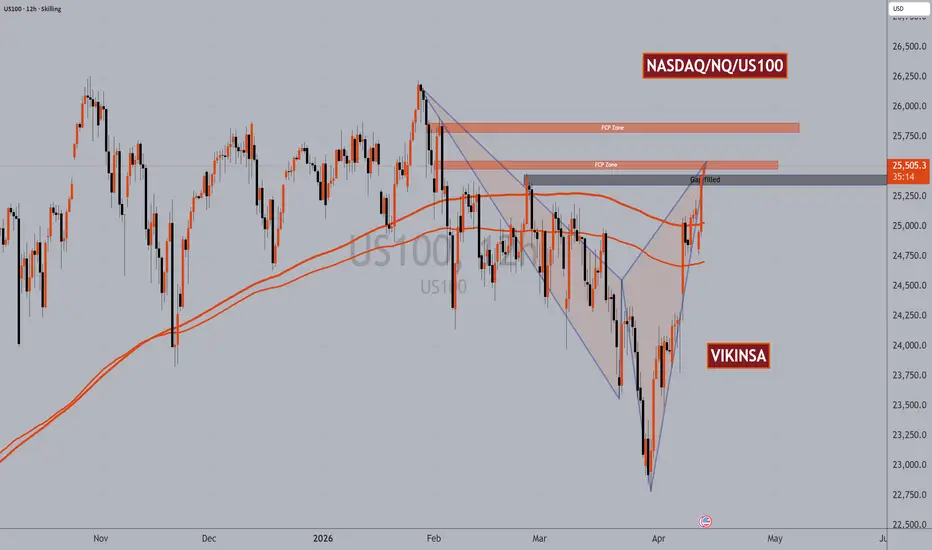
NQ NASDAQ Has Completed A W Pattern We have been bullish in NASDAQ as you know.
NQ (NASDAQ/US100/USTECH) now has filled the daily time frame gap and has completed a W pattern. it is still bullish so for any short opportunities, we need confirmation. We have 2 FCP zone which we need to watch out for.
No an advice as usual!
Be careful of the geopolitical situation though and manage the risk.
Follow for more. Please support this analysis by liking, commenting, and sharing with friends, colleagues, traders, and trading communitie
BTCUSD: Bullish Gartley Support Confirmed Targeting $155,627.72This is a follow-up to the previous bullish entry idea from 2 months ago at the bottom of the channel.
Over the last several weeks BTC has been putting in a bottom at the bottom of this channel both in terms of putting in a Double Bottom on the weekly timeframe and confirming a Bullish Inverted Hammer on last month's Monthly Close; in this time BTC has been taking back the 200-week moving average and given that BTC rarely stays below the 200-week Moving Average for long it is statistically li
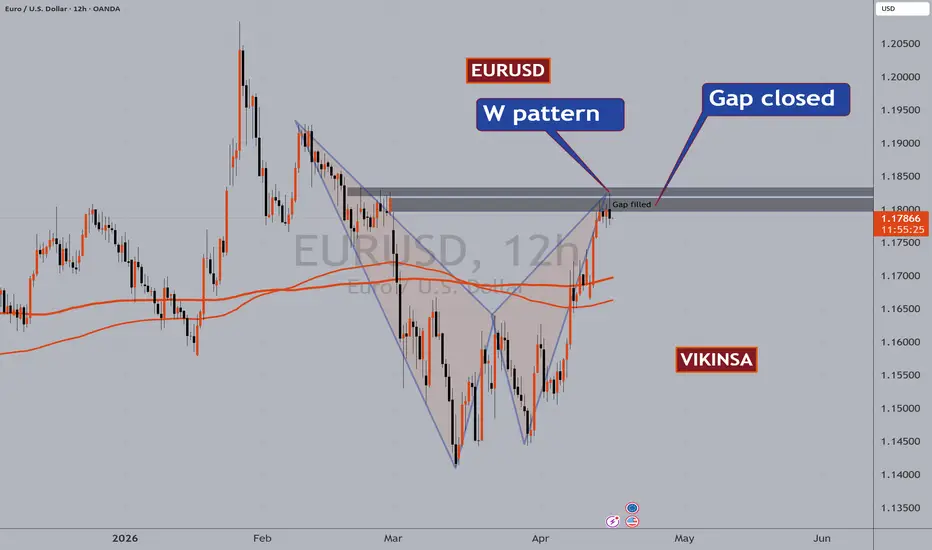
OIL Can make a bullish move againCrude OIL (WTI) can make a bullish move if can break through some of the resistance areas shown on the chart. As it has a huge up and then down move it may very well consolidate for sometime and then make it move. If it start to move upwards, it can form a W pattern and close the left over gap.
No an advice as usual!
Be careful of the geopolitical situation though and manage the risk.
Follow for more. Please support this analysis by liking, commenting, and sharing with friends, colleagues,
USDCAD Must be watched closely for Great Long OpportunityUSDCAD does not get its fair share of recognition.
It is one of the most underrated currency pairs but from my experience, when it works, it works beautifully especially with patterns. An a lot of analyst do not realise that it is a great indicator for the OIL prices.
At the moment on the weekly time frame, I see that it trying to breakout. If this is successful and confirmed, we can see completing a smaller W and even a bigger W pattern. This will means that USD will gain strength even from
S&P-500 Futures Bullish Gartley Entry at 200-day SMAThe Nasdaq-100 Futures have been holding up in the range printing potential Bullish Cup with Handle Pattern but the SPX Futures have come down to nearly a 0.886 retrace, completing a Bullish Gartley aligning with the 200-day SMA.
Oil has recently spiked above $110 which was likely the trigger for the SPX's decline, but at this point is likely to come crashing back down below $100 if not just for a week or so.
During this time we can likely see the SPX stage a recovery from this recent declin
US30 Dow Jones Is At An Important LevelStock Market this weeks opened with larges gaps and over all looking like ready for a correction. However, Dow Jones on daily time frame (as per my data feed) is sitting at 200 sma along with a few fibs. This can be the only chance for the market make a bounce from here. If this levels is broken with strength or broken and confirmed, we will see further larger correction.
Already posted about SNP500
Be careful of the geopolitical situation though and manage the risk.
Follow for more. Pleas
SNP500 Stock Market In Trouble?SNP500 seems to be showing signs of little troubles. It has formed a rounding top and this week it has opened with a major gap. Whilst gaps are not uncommon, this is still looking very bearish.
DAX (Germany 30), NASDAQ and all other major indices seem to have followed a similar pattern this week open.
Seems like market is about to take a correction.
Be careful of the geopolitical situation though and manage the risk.
Follow for more. Please support this analysis by liking, commenting, and
GOLD XAUUSD $GC Important Levels and Zones - UpdatedHell all,
Here are the updated levels and zones for the coming days and possibly weeks. read one level/zone at a time with price action.
Be careful of the geopolitical situation though and manage the risk.
Follow for more. Please support this analysis by liking, commenting, and sharing with friends, colleagues, traders, and trading communities. Thanks👍🙂
Taking Profit on BTC Shorts; Looking to Get Tiny Long ExposureOriginally Posted: 02/05/2026
Reposted For Compliance: 02/13/2026
BTC and MSTR are at potential PCZs of Bullish Gartley; The two assets moved down leading to MSTR earnings and negative unrealized losses expectations. I do think that BTC will ultimately move back down, but from where it is now, looking at all of the downside short leverage that has been building at these lower levels, I think there is a high chance of it short squeezing to the upside and for it to be fast and violent move up to
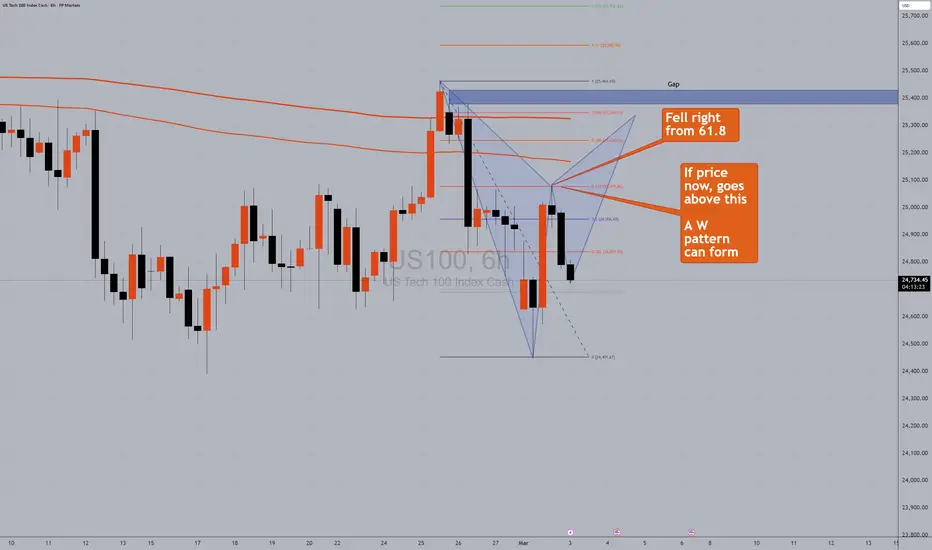
US100 NQ USTECH NASDAQ Can form a W PatternYesterday, price went higher reached 6.18 fib level. It fell exactly from there. Now if the price comes back up and challenges that point again, it can form an W pattern. We also have a gap open which may get filled.
Ba careful of the geopolitical situation though and manage the risk.
Follow for more. Please support this analysis by liking, commenting, and sharing with friends, colleagues, traders, and trading communities. Thanks👍🙂
Silver XAGUSD Has completed a W patternAlthough Silver XAGUSD has more room to rise further, it is at the moment completing a W pattern. This can push the price down a bit at least in a short term.
Ba careful of the geopolitical situation though and manage the risk.
Follow for more. Please support this analysis by liking, commenting, and sharing with friends, colleagues, traders, and trading communities. Thanks👍🙂
Bullish 2021 Bitcoin Fractal Suggests Bitcoin has BottomedBitcoin is sitting at the PCZ of a what can be plotted as both a Bullish Cypher and a Bullish gartley and on the 5D timeframe it is below the 200 Period SMA which it usually doesn't stay below for long; and is also sitting a the 1.618 Standard Deviation demand line of a Linear regression Channel while exhibiting Bullish Divergence on the MACD and starting to show a second recovery from oversold zones in the RSI after what was a sharp secondary decline into oversold zones and lastly on the price