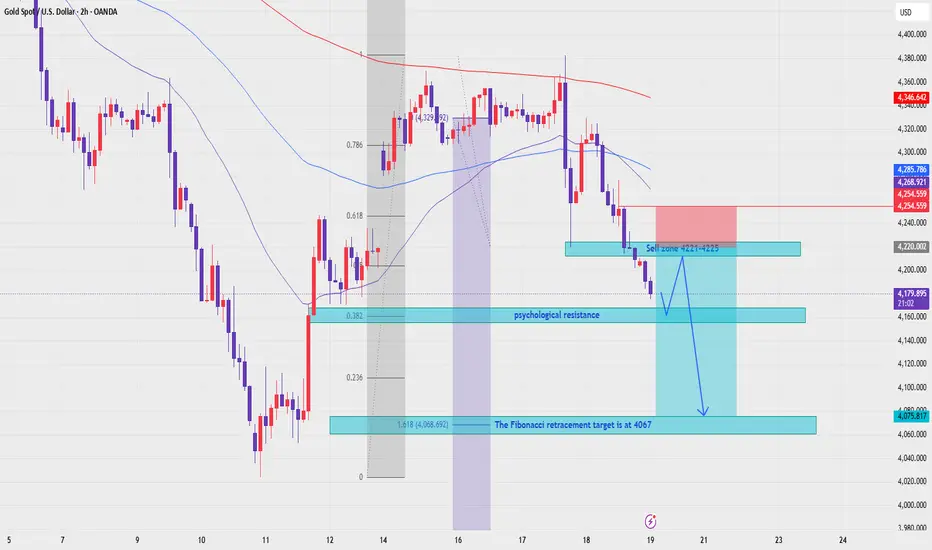
XAUUSD- Remains Under Heavy Selling Pressure
XAUUSD stays on the defensive as dollar strength and Fed hawkishness continue to weigh on gold.
Gold remains under strong downside pressure as the market adjusts to a firmer US dollar and a more hawkish Federal Reserve stance. The Fed kept rates unchanged at 3.50%–3.75% in its March meeting, while Powell signalled that higher oil prices linked to Iran could lift inflation in the short term. That matters because when inflation risks stay elevated, the market becomes more cautious on rate cuts, Treasury yields tend to stay supported, and the dollar gains strength. In that environment, gold usually struggles to hold firm.
From a macro perspective, this is not the kind of backdrop that supports aggressive upside in gold. A stronger dollar and reduced expectations for Fed easing are both working directly against the metal, and the chart is now reflecting that pressure clearly.
Technical Structure
From a technical standpoint, gold is trading in a clear bearish structure. Price has already broken below the descending support trendline and is now pressing into the lower demand zone around 4,750–4,780.
The structure currently shows:
price has lost trendline support
the market is testing the 4,750–4,780 reaction zone
if this area fails, the next major downside target opens near 4,550
any short-term rebound should still be treated as corrective while price stays below broken structure
This is no longer a chart that suggests stability. It is a chart where sellers remain in control and each bounce is at risk of being sold into again.
Key Price Zones
Immediate Support: 4,750–4,780
This is the current reaction area. It may trigger a short-term bounce, but it is also the final nearby support before the chart opens lower.
Major Downside Target: 4,550
If current support breaks decisively, this becomes the next major bearish target.
Overhead Pressure:
Any rebound into previously broken structure should still be watched carefully, because sellers may use those rallies to reload.
Market Scenarios
Corrective bounce:
Gold may react from the current support zone and produce a short-term rebound. But unless price reclaims broken structure with real strength, that bounce should still be treated as corrective.
Bearish continuation:
If the 4,750–4,780 support zone breaks cleanly, the downside may extend towards 4,550, which remains the next major target on the chart.
Key takeaway:
As long as gold stays below broken structure, sellers continue to hold the broader advantage.
Market Insight
Gold is now trading under a macro environment that clearly favours the dollar. A more hawkish Fed tone, fading rate-cut expectations, and renewed inflation concerns tied to oil are all reinforcing downside pressure on the metal.
From my perspective, the structure remains firmly bearish unless the market proves otherwise. A technical bounce can still happen from current support, but as long as gold stays below broken levels, the larger risk continues to point lower.
For now, the message is simple: gold is under pressure, and unless support holds with real strength, the path towards 4,550 remains open.
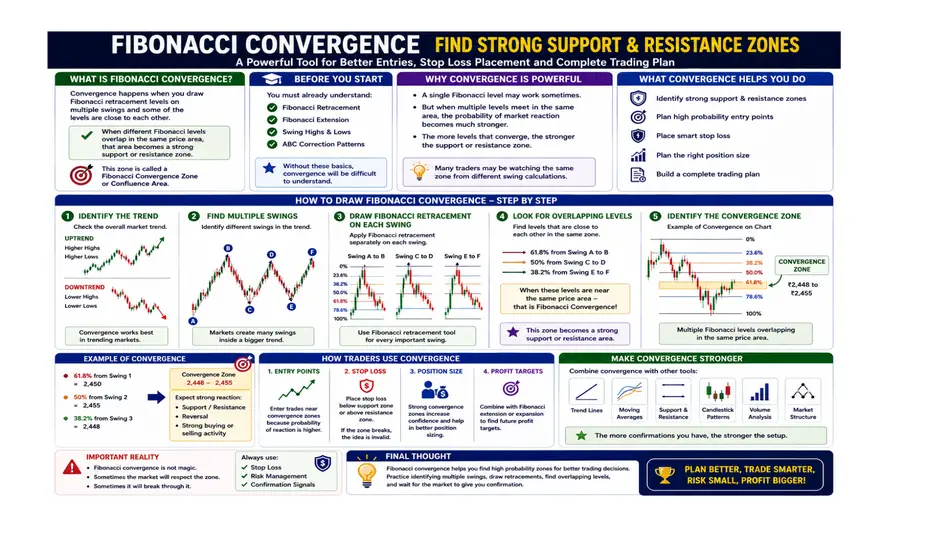
Fibonacci Extension
H2 - Gold Rebound Still Has Room
XAUUSD is trying to recover from a key support base.
Gold is holding firm after the recent sell-off, as price begins to react from a strong support area near the 5,000 zone. The market is still digesting a macro backdrop where easing Middle East tension has reduced part of the safe-haven premium, while expectations around Fed rate cuts remain less aggressive. That combination has limited gold’s upside, but it has not been enough to fully break the current support floor.
At this stage, the market is no longer just reacting to headlines. It is reacting to structure.
Technical Structure
From a technical perspective, gold is attempting to stabilize after dropping into a well-defined support region. The chart shows price pressing against the lower boundary of the recent structure while beginning to build a rebound from the trendline and the nearby demand base.
The current setup is clear:
price is holding above the strong support zone near 5,000
the first recovery level sits around 5,071
above that, the next upside target stands near 5,104
if momentum improves, the higher sell zone around 5,176 becomes the next key test
This means the market is still under broader pressure, but short-term price action is starting to favour a recovery move from support rather than an immediate breakdown.
Key Price Zones
Strong Support: 5,000
This is the main base holding the market for now. As long as gold stays above this region, the rebound structure remains valid.
First Recovery Zone: 5,071
This is the first level buyers need to reclaim. A push into this area would confirm that the current bounce is gaining traction.
Second Resistance: 5,104
This is the next important upside layer. If price clears this zone, the recovery structure becomes stronger.
Major Sell Zone: 5,176
This is the main upside barrier on the chart. It aligns with the upper sell area and remains the key resistance sellers may defend.
Market Scenarios
Scenario 1 – Hold Above 5,000 and Extend Higher
This is the recovery scenario.
If buyers continue defending the current support base, gold may rotate higher towards 5,071, then 5,104, with 5,176 as the next major upside test. That would suggest the recent weakness was more of a support retest than the start of a fresh bearish expansion.
Scenario 2 – Bounce Fails Below 5,104 or 5,176
Even if gold rebounds, resistance still matters.
If price moves higher but gets rejected around 5,104 or 5,176, the market may remain trapped in a corrective phase rather than transition into a full bullish reversal. In that case, buyers would still need stronger confirmation before claiming control.
Scenario 3 – Lose 5,000 and Invalidate the Recovery
This is the bearish invalidation.
If gold falls back below the current support zone with clear downside acceptance, the rebound view weakens significantly. That would suggest the support has failed and that sellers are regaining control of the short-term structure.
Market Insight
Gold is trying to recover, but this is still a market that needs confirmation.
The support area is doing its job for now, and that gives buyers room to push price higher in the short term. But for the rebound to become meaningful, the market needs to reclaim higher resistance layers one by one. Until that happens, this remains a recovery attempt inside a cautious structure, not a confirmed trend reversal.
From my perspective, the chart now favours a rebound scenario while price holds above 5,000.
If that support stays intact, gold has room to rotate back into 5,071, 5,104, and possibly 5,176.
For now, the message is simple: support is holding, and as long as that remains true, gold still has room to recover.
Dưới đây là bản ngắn hơn để đăng nhanh nếu anh cần:
Gold Rebound Still Has Room
XAUUSD is trying to recover from a key support base.
Gold is holding above the 5,000 support zone, and that keeps the recovery scenario alive in the short term. As long as this area remains protected, price may rebound towards 5,071, then 5,104, with 5,176 as the next major upside test.
The broader structure is still cautious, but the current reaction suggests buyers are defending support rather than giving up control completely.
For now, the view remains simple: hold above 5,000, and gold still has room to recover.
XAUUSD (D1) — Uptrend is intact— “Uptrend is intact… but the best long may come AFTER the final liquidity sweep”
Gold is still respecting the primary bullish structure on the higher timeframe, but the correction doesn’t look “finished” yet. Price has already reacted off the 0.618 Fibonacci, and the next high-probability area the market often tests in this kind of pullback is the 0.5 Fibonacci — where liquidity tends to complete before a cleaner push higher.
What matters next week is not chasing candles. It’s letting price come into the right zone, then using lower timeframes to confirm the long.
Market context for next week
The broader trend remains bullish, but the swing structure suggests the market may still be working through unfinished liquidity below. The bounce from 0.618 is a positive sign, yet it can also be a temporary reaction before price rebalances deeper.
Key levels to focus on
0.618 has been tested and produced a response.
0.5 Fibonacci (~4,917) is the main level to watch for a higher-quality long entry.
If price reaches the 0.5 zone, the goal is to confirm that sellers are being absorbed rather than assuming a bottom.
Primary trading scenario (preferred)
Price dips into the 0.5 Fibonacci zone (~4,917) to complete the liquidity sweep, then forms a base.
Execution approach: when price taps the zone, drop to H4/H1/M15 and only look to buy after clear confirmation such as:
a sweep below the zone and a quick reclaim back above
strong lower-wick rejection inside the zone
a break of minor bearish structure, followed by a successful retest
This is the “patient long” plan — letting the market prove strength before committing.
Upside path (once the long confirms)
After confirmation from the 0.5 zone, the first expectation is a rotation back into the upper reaction area (FVG zone).
If price accepts above that reaction zone, the move can extend toward the higher target area shown on the chart (the next expansion objective).
If the market doesn’t dip (alternative scenario)
If price holds higher and reclaims the upper reaction zone without revisiting 0.5, it becomes a momentum continuation environment. In that case, the plan shifts to waiting for a pullback/retest to avoid chasing.
Invalidation / risk boundary
If price breaks below the 0.5 area and fails to reclaim, the “buy-the-dip at 0.5” thesis loses quality. That’s the point to step aside and wait for a new structure rather than forcing a long.
USOIL - Weekly Chart outlookQuick take:
- Squeeze of Geopolitical where price has risen for $25 - 92 where a large choke of oil is in play.
Pullback on the daily- awaiting a reload zone:
Pullback retracements of that move:
Fib Price
0.236 ~86
0.382 ~82.5
0.5 ~79.5
0.618 ~76.5
Short term pull back:
0.236–0.382 retracement of the squeeze
• Prior weekly resistance / liquidity
• Under the $90 breakout area
current state of play: at $92 which is a strong growth and hitting a zone of interest on the 50% retracement , so will act accordingly.
Risk Warning
Trading leveraged products such as Forex, commodities and CFDs, carries with it a high level of risk and so may not be suitable for every investor. Prior to trading the foreign exchange, commodity or CFD market, consider your investment objectives, level of experience and risk appetite. You should never risk more than you can afford to lose. If you fail to understand or are uncertain of the risks involved, please seek independent advice and remember to conduct due diligence as criteria varies to suit the individual.
Do you enjoy the setups?
Professional analyst with 8+ years experience in the capital markets
Focus on technical output not fundamentals
Focus on investing for long term positional moves
Provide updates where necessary - with new updated ideas tracking the progress.
If you like the idea, please leave a like or comment.
To all the followers, thank you for your continued support.
--private script removed--
Escalating War, Yet Gold Falls – A Market Paradox?Escalating War, Yet Gold Falls – A Market Paradox?
Yesterday’s session saw a sharp drop in gold as price plunged from the 537x area down to 4996, marking roughly a 7% decline in a short period of time. After this sell-off, the market began to show dip-buying pressure and a technical rebound started to form.
What makes this move notable is that the drop occurred amid escalating geopolitical tensions, which are typically considered supportive factors for gold. However, this time the market reacted in the opposite direction.
The main reason comes from surging oil and energy prices due to concerns over supply disruptions, which has raised fears that inflation could return. As inflation expectations increase, the market also worries that the Fed may keep interest rates higher for longer, pushing the US Dollar Index (DXY) higher and putting downward pressure on gold prices.
This highlights an important reality: war or geopolitical tensions do not always mean gold will rise. The market primarily reacts to interest rates, liquidity flows, and the strength of the US dollar, so trading decisions should be based on price structure and technical context, rather than relying solely on news.
Trading Scenario for Today
After the sharp drop, gold is currently in a technical rebound phase, but the short-term structure still shows selling pressure dominating the market.
Main scenario: look for SELL opportunities on pullbacks toward resistance zones.
Alternative scenario: the market may consolidate sideways after the sharp decline, with a short-term range to watch between 5088 – 5200.
Key Price Levels
Resistance
5190 | 5205 | 5225 | 5230 | 5239 | 5260 | 5280 | 5330 | 5340 | 5360 | 5370 | 5380
Support
5140 | 5050 | 5000 | 4960 | 4850 | 4800
Trading Ideas
Sell the pullbacks near resistance zones | Short-term scalp buys near nearby support | Watch price reaction if the market continues to range between 5088 – 5200.
What’s your view on gold today?
Is this just a technical rebound before another leg down, or will the market consolidate longer before choosing the next direction?
$DXY Dollar Is Not Dead And Will Rise Much Higher - Breakout?I have been saying this time again and gain repeatedly that Dollar is being perceived as evil and a dead thing. But the reality is different. Dollar is getting bullish again. This is 3rd time in 6 years they said "Dollar is dead" and it has rather gained strength .
Check the charts for yourself. It is rising higher as expected and can breakout !!!!
Be careful of the geopolitical situation though and manage the risk.
Follow for more. Please support this analysis by liking, commenting, and sharing with friends, colleagues, traders, and trading communities. Thanks👍🙂
US–Israel vs Iran: Gold ATH or War Volatility?Weekly Gold Trading Plan
After the recent attack by the US and Israel on Iran that reportedly killed several high-ranking Iranian leaders, tensions in the Middle East have once again become a major focus for global financial markets.
At the moment, there are three main scenarios being discussed:
1️⃣ Iran weakens quickly after the strikes
2️⃣ The conflict spreads across the Middle East
3️⃣ A short-term conflict followed by de-escalation
From my personal perspective, the most probable scenario is a short-term conflict that eventually cools down.
This means:
War news can cause strong short-term volatility in gold prices.
However, whether gold will create a new ATH (All-Time High) depends largely on how much the geopolitical tensions escalate.
From my point of view, I do not favor the strong escalation scenario, so I prefer trading based on key price levels and market structure rather than chasing headlines.
In addition, at the current moment the market is also showing gaps and noticeable slippage following geopolitical news.
Therefore, traders should pay extra attention to risk management and position sizing.
Trading Plan for This Week
Main strategy:
Prefer waiting for pullbacks and buying in line with the trend.
Support Zones (Buy Zones)
5305 | 5279–5280 (Gap) | 5250 | 5238–5240 | 5170 | 5130
Resistance / Target Zones
5400 | 5415 | 5445–5450 | 5499–5500 | 5560 | 5600
Market Structure Decision Zone
5150 – 5130
If price breaks below this zone, the market structure could shift from bullish to bearish.
Notes
• War news often creates short-term volatility
• The market may experience gaps and slippage
• Avoid FOMO trading based on headlines
The key principle remains:
Trade the level — not the news.
💬 What’s your view on gold this week?
Will gold continue expanding toward 5500+?
Or will the market pull back deeper before the next move higher?
Feel free to share your perspective or trading scenario in the comments so we can discuss different viewpoints together.
Wishing everyone a disciplined and profitable trading week.
TBT | Expect Interests Rates To Surge | LONGProShares UltraShort 20+ Year Treasury seeks daily investment results, before fees and expenses, that correspond to two times the inverse (-2x) of the daily performance of the ICE U.S. Treasury 20+ Year Bond Index. The fund invests in financial instruments that ProShare Advisors believes, in combination, should produce daily returns consistent with the fund's investment objective. The index includes publicly-issued U.S. Treasury securities with minimum term to maturity greater than or equal to twenty years and have $300 million or more of outstanding face value, excluding amounts held by the Federal Reserve. The fund is non-diversified.
S&P 500: Roaring Twenties 2.0 Bullish Harmonic FractalNew Updated Commentary 2/20/2026:
Since the original post the S&P 500 has rallied from $4,000 to just above the 2.618 Fibonacci Extension to $7,000. Originally I noted that the 2.618 could act as potential resistance especially if the fed tightened at these levels but it would seem that as we've hit these all time highs, the fed has chosen to loosen and the odds of the balance sheet rising have gone up as Japanese inflation has gone back below the 2% target.
As a result we will likely see the fed be more willing to inflate the balance sheet further and keep rates lower or paused which will lead to a temporary loosening in the carry trade and therefore an opening in credit spreads which should allow institutions the margin needed to push the S&P 500 to the upper parts of this resistance zone mainly targeting the 3.168-4.00 extensions in one last blow-off top sort of move to complete the AB=CD harmonic and to even further align with the 1920s-1930s great recession fractal.
I think that during this time we will see the fed balance sheet rise, inflation to pick back up and for softs like: wheat, soybeans, and assets like oil and natural gas to rise. Once Oil rises enough it will start sparking up the CPI. This should be good for stocks at first but as inflation begins to increase and oil starts trading well into the 100s of dollars I would then start to worry and by that time, hopefully the SPX will be our next extension targets and confirming bearishness by breaking below our CD leg trendline because this is the point that I would want to get out and consider shorts as we'd likely see the central banks around the world be forced to raise rates significantly and reduce their balance sheets once more to combat inflation which will tighten spreads and likely revive the problem of the Japanese Carry Trade.
So while I see the market as still bullish I do think this bullishness is tentative and is setting up for one more rapid rise followed by an even greater decline which should be foreshadowed by a rise in CPI sparked by rising oil, rising softs, rising volatility, and a break of our CD wave trendline at one of our Fibonacci extensions above.
My original commentary posted on Apr 15, 2023:
In the lead up to the 1920s, the US Federal Reserve significantly increased its balance sheet by almost nine times, starting from 700 Million Dollars in December 1916 to 6.6 Billion Dollars by January 1920. This move was presumably to fund the US's entry into the First World War, which led to an increased demand for US government debt globally and loose lending conditions domestically, and low rates thereby encouraging a round of inflation in the US. However, after the war ended, the Fed stopped increasing the balance sheet, and between 1920 and 1922, they began to reduce it from the already elevated $6.6 billion to $4.8 billion, almost a 30% cut in just two years.
This action successfully controlled inflation but did not eliminate it completely, yet the dollar gained significant buying power, resulting in a somewhat disinflationary period. As a response to this, the Fed maintained the balance sheet within a tight range around $4.8 billion for a decade, neither raising nor lowering it much but the federal reserve did continue to significantly lower the interest rates; During this time, equities rallied.
While the 1920s were a period of economic growth and prosperity, there were warning signs of overheating towards the end of the decade. Investors were becoming overly speculative, leading to a surge in stock and real estate prices, while lending standards declined and consumer spending continued to rise rapidly.
To counteract these inflationary pressures, the Federal Reserve implemented policies to tighten credit conditions; They doubled interest rates and also raised reserve requirements for banks, which reduced the amount of money available for lending.
In essence this would kickstart The Great Depression which could have instead been a Simple Recession if only the fed had acted sooner as it wasn't their intention to crush the market but rather they just wanted to cool the market down a bit to contain inflation.
Years deep into the Great depression, the Federal Reserve realized they had gone too far. So, to fix this, they would begin to raise the balance sheet again while also cutting rates drastically in an effort to relieve pressure from the economy and promote new opportunities for economic growth, which then led to a new expansionary cycle.
With that all being said, it would appear that the Fed is doing now what it was doing back then. Over the last decade, they raised the balance sheet by 900% and lowered interest rates by over 95%. Only over the last year, they have begun to reduce the balance sheet by about 10% while raising rates by over 1500%. If we are to go off of the Harmonic Fractals on the chart, then we are likely nearing a point in time where the Fed will begin to loosen rate policy and bring the balance sheet back to all-time highs. This would align with the S&P reaching a 2.618 - 4.00 Retraces as the Fed attempts to keep policy as loose as possible in the hopes that inflation won't come back to bite them. But once we reach harmonic targets, we will likely see inflation return in a great way, which would then force the Fed to induce another Great Depression in the next several years rather they want to or not.
Technical Argument: ABCD BAMM, after breaking a long accumulation range and entering a long term expansionary cycle, we are now in the later phases of said cycle while showing heavy amounts of MACD Hidden Bullish Divergence and harmonically have room to go up significantly higher before it ultimately reaches D and comes to an end.
SNAP | Something is Bullishly Brewing | LONGAnalyzing Snap Inc. (SNAP) on the daily chart right now (mid-February 2026) reveals a classic descending wedge that is reaching its apex. After the heavy selling following the February 4th earnings report, the price action has begun to "tighten," which often precedes a high-velocity move.
1. The Descending Wedge Structure
The daily chart shows a clear pattern of lower highs and lower lows, but the slope of the support line is much flatter than the resistance line.
The Upper Resistance: This line is currently anchored by the pre-earnings highs and the "dead cat bounce" peaks near $5.40.
The Lower Support: Buyers have been stepping in consistently around the $4.80–$4.83 zone.
The Convergence: The price is being squeezed into a very narrow range. Historically, when SNAP breaks out of such a wedge, the move is sharp because of the high short interest often trapped in these "beaten-down" growth names.
2. Volume and Accumulation (Your Key Signal)
Following the high-volume gap down on February 5th, we’ve seen a shift in the "tape":
Churn at the Bottom: While the price has drifted slightly lower, volume has been drying up on the red days.
Green Spikes: We’ve seen a few "buy-the-dip" spikes on the 2-hour and daily timeframes, suggesting that institutional buyers might be accumulating shares while retail sentiment remains at "Strong Sell" levels.
3. Bullish Divergence (Multi-Timeframe Analysis)
A significant bullish RSI divergence has formed. While the price made a fresh low yesterday (Feb 13), the RSI on the daily chart has actually moved higher.
This suggests that the "velocity" of the selling is exhausted.
When you see price making lower lows but the RSI making higher lows, it’s often the final "flush" before a wedge breakout.
4. Fundamental Drivers for the Breakout
The market is currently weighing the "bad news" from the Q4 report (the 4% drop in North American DAUs and the Perplexity deal delay) against the valuation.
Valuation Gap: SNAP is trading near its all-time lows, but analysts are starting to point to the 2026 launch of "Specs" (AR Glasses) and the $500 million buyback as potential floors.
The "Perplexity" Catalyst: Any update on the broader rollout of the Perplexity AI partnership could act as the spark that forces the price above the wedge resistance.
Trading Levels to Watch:
The Breakout Point: A daily close above $5.20 on high volume would confirm the wedge breakout.
Target 1 ($5.50 - $6.50): This is the immediate resistance zone and the 50-day EMA.
Target 2 ($8.00 - $9.50): The median "Fair Value" target if the market starts pricing in the AR growth narrative for late 2026.
Stop-Loss: A decisive break below the $4.80 support would invalidate the pattern.
Given the 2-hour divergences you usually track, keep an eye on the $5.10 level. If it flips to support on the 2-hour timeframe, it’s likely the daily wedge breakout has begun.
Negotiation or Bloodshed? 5300 vs 50001️⃣ Price Action
Gold recently made a strong rally of more than 100 points, followed by a sharp pullback with clear profit-taking pressure.
Currently, price is fluctuating around the 516x area and showing signs of consolidation within a narrow range after the strong volatility move.
2️⃣ Market Context
The main focus at the moment is the US – Iran negotiations.
Military actions (ballistic missiles, aircraft carriers…) are being used as strategic tools to apply pressure during the negotiation process.
Just one strong headline or an escalation in tensions → gold could react very aggressively.
📌 At this stage, geopolitical news is the primary driver of price behavior.
3️⃣ Trend & Structure
Main trend: Still bullish.
Short-term: Corrective phase with potential sideways movement within a tight M15 range.
4️⃣ Key Levels
Support:
5140 – 5121 – 5100 – 5090 – 5050 – 5023 – 4980 – 4960
Resistance:
5192 – 5200 – 5250 – 5290 – 5300
5️⃣ Current Consolidation Range (M15)
Upper boundary: 5194 – 5200
Lower boundary: 5140 – 5160
📌 Price may continue consolidating within this range before a breakout.
6️⃣ Main Scenarios
🔹 If price holds above 5140 → bullish structure remains valid → targets 5250 – 5290 – 5300.
🔹 If price clearly breaks below 5140 → short-term structure weakens → potential expansion toward 5100 – 5050 – 5000.
7️⃣ Strategy
Buy at support with confirmation.
Sell at resistance with rejection signals.
Avoid trading in the middle of the range.
8️⃣ Notes
The market is currently driven by news → fast and deep volatility is possible.
Always define Entry – SL – RR clearly.
Strict risk management. Do not leave stops loose.
Avoid FOMO on headline spikes.
This is a personal view for reference only.
Wishing everyone an effective trading day.
BRK-B | Insurance Does Great with Higher Interest Rates | LONGBerkshire Hathaway, Inc. is a holding company, which engages in the provision of property and casualty insurance and reinsurance, utilities and energy, freight rail transportation, finance, manufacturing, and retailing services. It operates through the following segments: Insurance, Burlington Northern Santa Fe, LLC (BNSF), Berkshire Hathaway Energy (BHE), Pilot Travel Centers (PTC), Manufacturing, McLane, and Service and Retailing. The Insurance segment includes the underwriting of GEICO, Berkshire Hathaway Primary Group, and Berkshire Hathaway Reinsurance Group. The BNSF segment involves the operation of railroad systems. The BHE segment focuses on regulated electric and gas utility, power generation and distribution, and real estate brokerage activities. The PTC segment consists of managing travel centers and marketing of wholesale fuel. The Manufacturing segment refers to industrial, consumer and building products, home building, and related financial services. The McLane segment covers the wholesale distribution of groceries and non-food items. The Service and Retailing segment relates to the provision of shared aircraft ownership programs, aviation pilot training, electronic components distribution, retailing businesses, automobile dealerships and trailer, and furniture leasing services. The company was founded by Oliver Chace in 1839 and is headquartered in Omaha, NE.
Chumtrades xauusd friday trade planMarket Context
Gold is currently trading within a wide range, with the short-term structure still bearish. Price remains capped below the descending trendline, and each rebound weakens as it approaches resistance, indicating defensive, short-term capital flow with no clear signs of accumulation for a reversal yet.
Key Macro Factors
Markets remain under pressure from concerns about higher-for-longer interest rates, as monetary policy has not shifted toward easing. U.S. labor data volatility keeps gold highly sensitive to news, while rate-cut expectations for March–April remain low, offering insufficient support for a sustained bullish move. Geopolitical risks persist but currently act more as noise than a trend driver.
Market Expectations
Buyers are looking for short-term technical rebounds from demand zones, while sellers are waiting for pullbacks into resistance to continue distribution. Overall, the market appears to be positioning for a strong breakout, with elevated volatility risks heading into the weekend.
Intraday Trading Strategy
Bias remains SELL, trading in line with the prevailing structure. Look to sell on pullbacks into the 4,900–4,950 resistance area or near the descending trendline. BUY setups are strictly short-term reaction trades at support, with no intention to hold positions for long. Avoid chasing price during high-volatility moves.
Support zones: 4,825–4,836 | 4,800–4,814 | 4,750–4,766 | 4,640–4,700.
Resistance zones: 4,900–4,950 | 5,000 | a break above 5,100 would invalidate the bearish structure.
Friday Notes ⚠️
Fridays often carry the risk of sudden sell-offs, especially after 22:00 (VN time). On news-driven sessions, price can move fast and aggressively, increasing the risk of stop hunts. With wide volatility, tight risk management, smaller position sizing, and capital preservation should take priority over profit-seeking.
AG | Silver Miners Will Rise | LONGFirst Majestic Silver Corp. engages in the production, development, exploration and acquisition of mineral properties. It owns and operates producing mines in Mexico including the La Encantada Silver Mine, La Parrilla Silver Mine, San Martin Silver Mine, La Guitarra Silver Mine, Del Toro Silver Mine, Santa Elena Silver & Gold Mine, and San Dimas Silver & Gold Mine. The company was founded by Keith Neumeyer on September 26, 1979 and is headquartered in Vancouver, Canada.
KRE | Regional Banks Showing Strength | LONGSPDR S&P Regional Banking ETF seeks to provide investment results that, before fees and expenses, correspond generally to the total return performance of an index derived from the regional banking segment of the U.S. banking industry. In seeking to track the performance of the S&P Regional Banks Select Industry Index (the "index"), the fund employs a sampling strategy. It generally invests substantially all, but at least 80%, of its total assets in the securities comprising the index. The index represents the regional banks segment of the S&P Total Market Index ("S&P TMI").
UNH: adding into fear after a completed ABC correctionThesis
NYSE:UNH has completed its corrective ABC structure and is stabilizing within Wave 2, offering long-term accumulation opportunities in a proven cash-flow compounder.
Context
- Daily and weekly timeframes
- Deep corrective phase already completed
- Long-term uptrend remains intact on the weekly chart
- Dividend-paying, high free-cash-flow defensive name
What I see
- Yesterday’s selloff was headline-driven, not structural
- Price is holding inside the Wave 2 retracement zone
- Volatility is shaking out weak hands, not breaking structure
- This behavior is typical at the end of corrective phases
- I added to my long-term position yesterday, bringing my average into the $270s
What matters now
- The priority is stabilization and base-building
- A reclaim of the 50-day MA improves short-term structure
- Reclaiming the 200-day MA confirms the next impulsive leg
- Gap-filling narratives are noise, not a strategy
Buy / Accumulation zone
- Accumulation remains valid inside the current Wave 2 range
- I have no issue adding again once price stabilizes
- Risk is defined against the recent correction lows
Targets
- First major structural reference: 200-week MA near $460
- Wave 3 target remains the 1.618 Fib extension around $540
- Dividend yield (~2.6%) pays while waiting
Execution note
- This game isn’t for everyone — pressure exposes conviction
- I added at $250 and $240 when sentiment was darkest
- Buffett added at higher prices, yet fear returned instantly
- NYSE:UNH is my current safe-haven: strong FCF, cash-rich, defensive
This is a 3–5 year hold for me, not a short-term trade
SLI | Lithium Extraction Technology on the Rise | LONGStandard Lithium Ltd. engages in the testing and proving of the commercial viability of lithium extraction. Its projects include Arkansas Lithium, Lithium Brine Processing, and California Lithium. The company was founded by Alvaro Anthony on August 14, 1998 and is headquartered in Vancouver, Canada.
GME | Will We See Another Meme Rally | LONGGameStop Corp. engages in offering games and entertainment products through its ecommerce properties and stores. The firm's stores and ecommerce sites operate primarily under the names GameStop, EB Games, and Micromania. It operates through the following geographical segments: United States, Canada, Australia, and Europe. The company was founded by Daniel A. DeMatteo in 1996 and is headquartered in Grapevine, TX.
RSG | Waste Management Is Here To Stay | LONGRepublic Services, Inc. engages in the provision of environmental services. It operates through the following segments: Group 1, Group 2, and Group 3. The Group 1 segment focuses on the business of recycling and solid waste in geographic areas located in western United States. The Group 2 segment includes the recycling and solid waste business in geographic areas located in the southeastern and mid-western and the eastern seaboard of the United States. The Group 3 segment includes environmental solutions business in geographic areas located across the United States and Canada. The company was founded in 1996 and is headquartered in Phoenix, AZ.
GBP/USD targets 1.35 after mixed UK jobs! Break or reversal?Today, we are doing a dive into GBP/USD following a mixed UK jobs report that has left traders scratching their heads. While unemployment has spiked to a 4-year high, sticky wage growth and new tariff threats from President Trump are keeping the pound bid. Is a breakout to 1.35 imminent, or is the labour market crack a warning sign?
We analyse the conflicting signals from the UK economy: unemployment rose to 5.1% in December (highest since 2021), yet wage growth held firm at 4.7%, keeping the BOE cautious on rate cuts. We overlay this with the "Greenland Tariff" threat weakening the US dollar and map out the technical path to 1.3568.
Key topics:
UK Jobs data: A breakdown of the December report—unemployment up to 5.1%, 43k job losses, yet sticky wages (4.7%) are preventing a dovish pivot from the BoE.
Trump tariff threat: How President Trump’s weekend threat to impose 10% tariffs on 8 EU nations (including the UK) over the Greenland dispute is pressuring the dollar and supporting cable.
Technical setup :
Bullish flag breakout: GBP/USD has reclaimed the 1.3400 handle and is holding above the 50% Fibonacci retracement.
Golden pocket: Currently testing the 1.3481 "golden pocket." A break here targets the 1.3568 cycle high.
Extension target: The 100% Fib extension points to 1.3500 as the immediate hurdle, with 1.3539 and 1.3562 above that.
This content is not directed to residents of the EU or UK. Any opinions, news, research, analyses, prices or other information contained on this website is provided as general market commentary and does not constitute investment advice. ThinkMarkets will not accept liability for any loss or damage including, without limitation, to any loss of profit which may arise directly or indirectly from use of or reliance on such information.
Are you speculating on a 1.35 breakout or fading the weak labour data? Let us know in the comments!
XAG to hit the psychological level of $100Targets are still very much bullish for 2026.
$100short term target
looking for a range between $80-100 for building up a liquidity block
Demand zone $71-74 - area of interest.
Daily (short term interest)
www.tradingview.com
Weekly
www.tradingview.com
Monthly Cup an Handle
www.tradingview.com
Calc of cup and handle:
Key zones
Critical resistance zones throughout the pattern:
Time Period Resistance Level Pattern Phase
1980-2011 $50+ (1980 high) Cup Formation
2011-2024 $49-$50 zone Handle Development
Late 2024 $50-$52 range Pre-breakout
Nov 2025 $55+ achieved Breakout Confirmation
Cup Structure (Multi-Decade)
Left Rim: ~1979–1980 highs near $49/oz — first peak.
Base: ~1982–2004 range near ~$3.46–$6.12 — extended bottom.
Right Rim: ~2011 high near ~$49/oz — second peak.
Handle structure:
Breakout Resistance: $49 (referring to 1979-80 and 2011), now 2025
$49-$3.46 = $45.54
use the extension target of $45.54 + $49 (breakout resistance) = $94.54 as a first point of reversal zone for an extension target.
Risk Warning
Trading leveraged products such as Forex, commodities and CFDs, carries with it a high level of risk and so may not be suitable for every investor. Prior to trading the foreign exchange, commodity or CFD market, consider your investment objectives, level of experience and risk appetite. You should never risk more than you can afford to lose. If you fail to understand or are uncertain of the risks involved, please seek independent advice and remember to conduct due diligence as criteria varies to suit the individual.
Below are some of the take aways from the video - please listen again incase any detail is missed.
Do you enjoy the setups?
Professional analyst with 8+ years experience in the capital markets
Focus on technical output not fundamentals
Focus on investing for long term positional moves
Provide updates where necessary - with new updated ideas tracking the progress.
If you like the idea, please leave a like or comment.
To all the followers, thank you for your continued support.
LVPA MMXXVI
Chumtrades XAUUSD H2 | Is the Liquidity Sweep Over?On Friday, the market reacted strongly after Trump’s comments regarding Kevin Hassett, when Trump expressed his preference for Hassett to remain in his current role rather than taking a new position.
👉 As a result, gold printed a long wick liquidity sweep back into the prior ATH zone, around 4530–453X, before closing back above 456X.
This brings us to the key question:
Was this sweep enough for the BUY side, or is the market still looking to test lower levels?
Political developments will be a key driver for gold direction in the coming week.
📰 Key Political Factors to Monitor
1. Trump – Greenland
The US has imposed 10% tariffs, with the possibility of increasing them to 25% on countries that do not support the annexation of Greenland
No fixed deadline, tariffs remain until Greenland becomes part of the US
→ This is a supportive factor for gold, especially amid rising geopolitical uncertainty
→ This news may directly impact the market open
→ If price reacts strongly, avoid SELLs near resistance
2. Iran – Protests
Monitor the risk of Trump returning to direct intervention
→ A potential headline-driven volatility trigger
🟢 Key Support Zones to Watch
4530 – 4535
4515 – 4510
4480 – 4482
4462
4410 – 4407
🔴 Key Resistance Zones to Monitor
4618 – 4628
4648 – 4650
4655 – 4660
4698 – 4699
⚠️ Trading Notes
Price levels are zones for observation, not instant entry points
SELL setups around 462X must be evaluated based on news reaction
If momentum accelerates on headlines → stay flat and avoid trading against strength
💬 Question for the New Week
Is the market finishing its liquidity collection on the BUY side,
or was Friday’s sweep the final test before the next leg higher?
📌 Follow www.tradingview.com for proactive market analysis, structured trade planning, and risk management insights.
PM | Tobacco On The Rise | LONGPhilip Morris International, Inc. is a holding company, which engages in the business of delivering a smoke-free future and evolving a portfolio for the long term to include products outside of the tobacco and nicotine sector. It operates through the following geographical segments: Europe Region (Europe), South and Southeast Asia, Commonwealth of Independent States, Middle East, and Africa Region (SSEA, CIS, and MEA), East Asia, Australia, and PMI Duty Free Region (EA, AU, and PMI DF), and Americas Region (Americas). The Europe segment includes all the European Union countries, Switzerland, the United Kingdom, Ukraine, Moldova, and Southeast Europe. The SSEA, CIS, and MEA segment focuses on South and Southeast Asia, the African continent, the Middle East, Turkey, Israel, Central Asia, Caucasus, and Russia. The EA, AU, and PMI DF segment is involved in the consolidation of international duty-free business with East Asia and Australia. The Americas segment is comprised of the United States, Canada, and Latin America. The company was founded by Philip Morris in 1847 and is headquartered in Stamford, CT.