CYCLE 5 QUESTIONI have been using the Nikkei comparison for one reason: not to claim that Bitcoin has to copy another market, but to understand where the current structure may sit inside a much longer cycle.
The similarity is not in individual candles. It is in the sequence.
Nikkei moved through four distinct expansion and reset phases before the final acceleration of Cycle 5. Each cycle pushed price into the same rising long term structure, followed by another period of weakness, doubt and rebuilding. The important part came after the fourth rejection. What looked like another completed cycle was eventually followed by the strongest expansion on the entire chart.
Bitcoin has now reached a very similar location. The first major cycle ended in 2013. The next major peak came in 2017. Another expansion followed into 2021. Then Bitcoin reached roughly $126K in 2025 before entering the current reset. On a standard four year reading, that move is easy to interpret as another finished cycle.
I do not think the structure is that simple.
What interests me is that the current rejection is appearing at the same relative stage where the Nikkei comparison moved from Cycle 4 into Cycle 5. In both structures, price had already experienced several major expansions. The market had already matured. The easy early cycle gains were gone. What remained was a much larger question about whether the final rejection represented exhaustion or preparation for one last repricing phase.
This is where the current Bitcoin debate becomes important. If $126K was a traditional cycle top, then the market should continue behaving like a completed expansion and spend the next phase rebuilding from much lower levels. But if $126K was only the Cycle 4 rejection, then the current weakness has a completely different meaning. It becomes the reset between Cycle 4 and Cycle 5.
That is the scenario I am watching.
The Nikkei example also shows why the largest move does not always arrive early in a market's life. Mature assets can spend years building structure before entering their strongest repricing phase. By the time that expansion begins, the market usually looks too old, too obvious or too exhausted to produce anything extraordinary.
That is exactly why the current Bitcoin structure deserves attention. market is focused on whether the previous high was the end. larger cycle question is whether it was actually the last major resistance point before a final expansion. I am not using Nikkei as a price target and I am not expecting Bitcoin to reproduce the same path candle for candle. The value of the comparison is in cycle location, market psychology and the sequence of expansion, rejection, reset and repricing.
For now, Bitcoin is sitting at the part of the map where the next cycle will define the entire thesis. If the parallel continues, $126K will not be remembered as the final top.
It will be remembered as the point where Cycle 5 began to take shape. CRYPTOCAP:BTC  Long
Long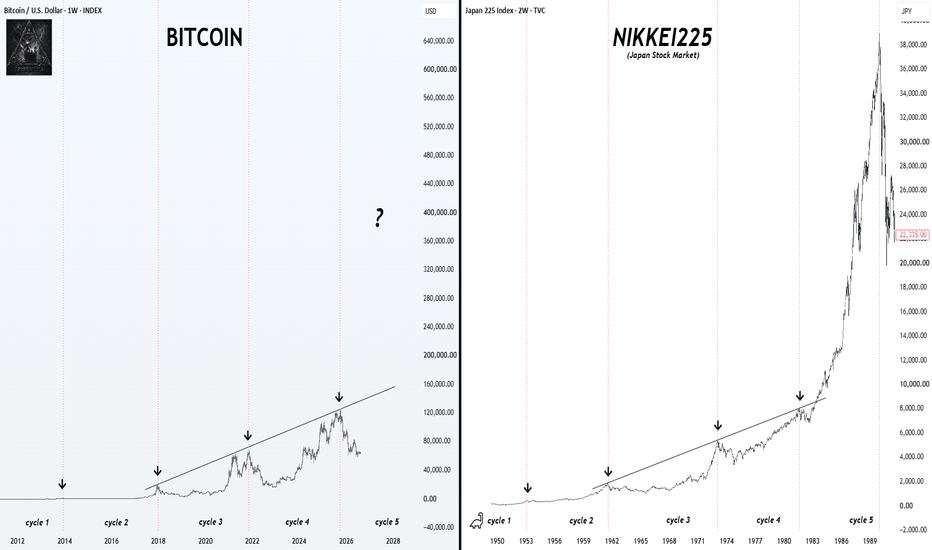
 Short
Short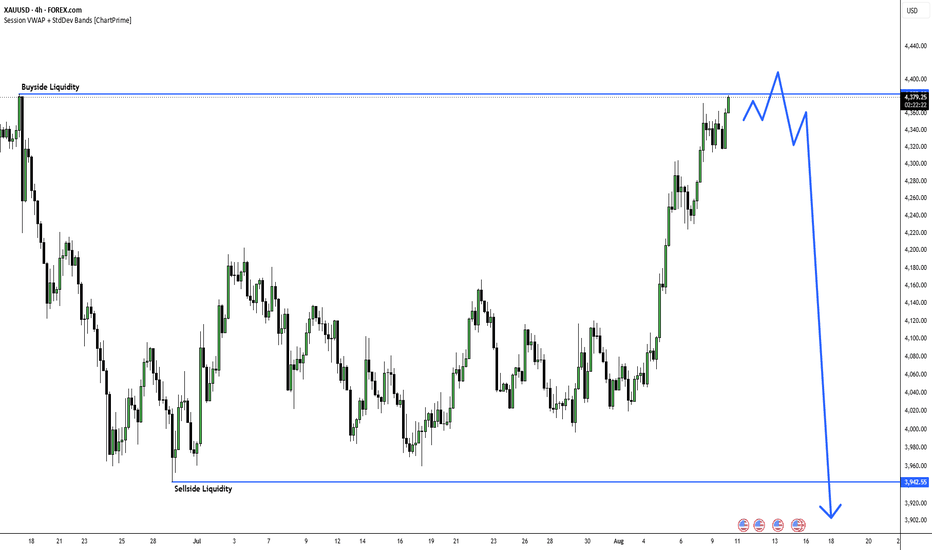
XAU/USD 10 August 2026 Intraday AnalysisH4 Analysis:
-> Swing: Bullish.
-> Internal: Bearish.
Bias and analysis to remain the same as analysis dated 30 June 2026.
Price did not print bullish CHoCH to indicate bullish pullback phase initiation. Price instead printed a new low followed by a bullish CHoCH
Price is currently trading within and established internal range, however, I will continue to monitor price with respect to depth of pullback.
Intraday expectation:
Price to trade up to either premium of internal 50% EQ, or H4 demand zone before targeting weak internal low, currently priced at 3,942.100.
Note:
Gold remains volatile as tensions between the US, Israel, and Iran keep safe‑haven demand elevated.
Markets are reacting quickly to every headline, while uncertainty around the Fed’s easing path and shifting U.S. policy under President Trump, especially tariffs continues to fuel choppy price action.
For newer traders, the key is simple, stay flexible and manage risk carefully, as fast spikes and sudden reversals are a normal part of the current XAU/USD environment.
H4 Chart:
M15 Analysis:
-> Swing: Bearish.
-> Internal: Bullish.
As I mentioned in my analysis dated 06 August 2026 whereby I mentioned price printed a bearish CHoCH but I would be monitor depth of pullback.
Price did not pullback with any significance, therefore, I will not classify the previous iBOS. I have however marked this is in red for illustration purposes.
Price has since printed higher. CHoCH positioning is denoted with a blue dotted horizontal line.
Price is currently trading within a fractal high and internal low.
Intraday expectation:
Price to print bearish CHoCH to indicate bearish pullback phase initiation. Price to then trade down to either discount of internal 50% EQ, or M15 supply zone before targeting weak internal high, priced at 4,371.840.
Note:
Gold remains highly reactive on M15 as geopolitical risk continues to drive quick, headline‑led moves.
The tension between the US, Israel, and Iran is keeping safe‑haven demand elevated, with markets still sensitive to any sign of escalation.
At the same time, shifting US tariff policy under President Trump is adding extra uncertainty, fuelling sharp intraday swings and increasing the likelihood of sudden sentiment flips. Liquidity pockets and whipsaws remain common, making disciplined risk management essential.
Gold’s geopolitical premium is still firmly in place, and until tensions ease, short‑term volatility is likely to stay front‑loaded.
M15 Chart:
NAS100 WEEKLY FORECAST | DAILY FVG REJECTION
Today, I’m sharing my technical analysis of the NASDAQ 100 and highlighting a few important points from the current market structure.
If you look at the previous week, you can see that the market showed strong bullish momentum. During this move, the price successfully broke above its trendline with strong bullish displacement, which indicates that buyers are currently showing strength.
After the breakout, the price retraced toward a recent Fair Value Gap (FVG) on the daily timeframe and produced a very strong rejection from that area. This rejection provides additional confirmation that buyers are defending the level and that the bullish momentum may continue.
The next important level to watch is around 30,700, which is the potential resistance/target area above the current price.
One of the key reasons I remain bullish is that, between the current price and the 30,700 level, I do not see any significant Point of Interest (POI) where the price is likely to face strong resistance or experience a major reversal.
As a result, there is a strong possibility that the price could continue moving higher toward the 30,700 level, provided the current bullish structure remains intact.
As always, this is a technical analysis based on the current market structure and not a guarantee of future price movement. Proper risk management should always be part of any trading plan.
Thank you.
XAU/USD 07 August Intraday AnalysisH4 Analysis:
-> Swing: Bullish.
-> Internal: Bearish.
Bias and analysis to remain the same as analysis dated 30 June 2026.
Price did not print bullish CHoCH to indicate bullish pullback phase initiation. Price instead printed a new low followed by a bullish CHoCH
Price is currently trading within and established internal range, however, I will continue to monitor price with respect to depth of pullback.
Intraday expectation:
Price to trade up to either premium of internal 50% EQ, or H4 demand zone before targeting weak internal low, currently priced at 3,942.100.
Note:
Gold remains volatile as tensions between the US, Israel, and Iran keep safe‑haven demand elevated.
Markets are reacting quickly to every headline, while uncertainty around the Fed’s easing path and shifting U.S. policy under President Trump, especially tariffs continues to fuel choppy price action.
For newer traders, the key is simple, stay flexible and manage risk carefully, as fast spikes and sudden reversals are a normal part of the current XAU/USD environment.
H4 Chart:
M15 Analysis:
-> Swing: Bearish.
-> Internal: Bullish.
Analysis and bias remain the same as yesterday's analysis dated 06 August 2026
Analysis did not print according to my analysis dated 20 July 2026.
Price instead targeted strong internal high and printed a bullish iBOS.
Price has subsequently printed a bearish CHoCH to indicate bearish pullback phase initiation. I shall however continue to monitor price with respect to depth of pullback.
Price is currently trading within an established internal range.
Intraday expectation:
Price to trade down to either discount of internal 50% EQ, or M15 supply zone before targeting weak internal high, priced at 4,304.310.
Note:
Gold remains highly reactive on M15 as geopolitical risk continues to drive quick, headline‑led moves.
The tension between the US, Israel, and Iran is keeping safe‑haven demand elevated, with markets still sensitive to any sign of escalation.
At the same time, shifting US tariff policy under President Trump is adding extra uncertainty, fuelling sharp intraday swings and increasing the likelihood of sudden sentiment flips. Liquidity pockets and whipsaws remain common, making disciplined risk management essential.
Gold’s geopolitical premium is still firmly in place, and until tensions ease, short‑term volatility is likely to stay front‑loaded.
M15 Chart: XAU/USD 06 August 2026 Intraday AnalysisH4 Analysis:
-> Swing: Bullish.
-> Internal: Bearish.
Bias and analysis to remain the same as analysis dated 30 June 2026.
Price did not print bullish CHoCH to indicate bullish pullback phase initiation. Price instead printed a new low followed by a bullish CHoCH
Price is currently trading within and established internal range, however, I will continue to monitor price with respect to depth of pullback.
Intraday expectation:
Price to trade up to either premium of internal 50% EQ, or H4 demand zone before targeting weak internal low, currently priced at 3,942.100.
Note:
Gold remains volatile as tensions between the US, Israel, and Iran keep safe‑haven demand elevated.
Markets are reacting quickly to every headline, while uncertainty around the Fed’s easing path and shifting U.S. policy under President Trump, especially tariffs continues to fuel choppy price action.
For newer traders, the key is simple, stay flexible and manage risk carefully, as fast spikes and sudden reversals are a normal part of the current XAU/USD environment.
H4 Chart:
M15 Analysis:
-> Swing: Bearish.
-> Internal: Bullish.
Analysis did not print according to my analysis dated 20 July 2026.
Price instead targeted strong internal high and printed a bullish iBOS.
Price has subsequently printed a bearish CHoCH to indicate bearish pullback phase initiation. I shall however continue to monitor price with respect to depth of pullback.
Price is currently trading within an established internal range.
Intraday expectation:
Price to trade down to either discount of internal 50% EQ, or M15 supply zone before targeting weak internal high, priced at 4,304.310.
Note:
Gold remains highly reactive on M15 as geopolitical risk continues to drive quick, headline‑led moves.
The tension between the US, Israel, and Iran is keeping safe‑haven demand elevated, with markets still sensitive to any sign of escalation.
At the same time, shifting US tariff policy under President Trump is adding extra uncertainty, fuelling sharp intraday swings and increasing the likelihood of sudden sentiment flips. Liquidity pockets and whipsaws remain common, making disciplined risk management essential.
Gold’s geopolitical premium is still firmly in place, and until tensions ease, short‑term volatility is likely to stay front‑loaded.
M15 Chart: XAU/USD 05 August 2026 Intraday AnalysisH4 Analysis:
-> Swing: Bullish.
-> Internal: Bearish.
Bias and analysis to remain the same as analysis dated 30 June 2026.
Price did not print bullish CHoCH to indicate bullish pullback phase initiation. Price instead printed a new low followed by a bullish CHoCH
Price is currently trading within and established internal range, however, I will continue to monitor price with respect to depth of pullback.
Intraday expectation:
Price to trade up to either premium of internal 50% EQ, or H4 demand zone before targeting weak internal low, currently priced at 3,942.100.
Note:
Gold remains volatile as tensions between the US, Israel, and Iran keep safe‑haven demand elevated.
Markets are reacting quickly to every headline, while uncertainty around the Fed’s easing path and shifting U.S. policy under President Trump, especially tariffs continues to fuel choppy price action.
For newer traders, the key is simple, stay flexible and manage risk carefully, as fast spikes and sudden reversals are a normal part of the current XAU/USD environment.
H4 Chart:
M15 Analysis:
-> Swing: Bearish.
-> Internal: Bearish.
Analysis and bias remains the same as analysis dated 20 July 2026.
Price has printed according to analysis dated 14 July 2026 where I mentioned price to trade up to either premium of internal 50% EQ, or M15 demand zone before targeting weak internal low, priced at 3,983.545. This is how price printed.
Price has subsequently printed a bullish CHoCH to indicate bullish pullback phase initiation. Price has since printed lower. Depth of pullback has been insignificant, therefore, I will not classify the bearish iBOS, however, I have marked this in red for illustration purposes.
Price has since printed a further bullish CHoCH and once again price is trading within an established internal range, however, I shall again monitor price action with regards to depth of pullback.
Intraday expectation:
Price to trade up to either premium of internal 50% EQ, or M15 demand zone before targeting weak internal low, priced at 3,959.800.
Note:
Gold remains highly reactive on M15 as geopolitical risk continues to drive quick, headline‑led moves.
The tension between the US, Israel, and Iran is keeping safe‑haven demand elevated, with markets still sensitive to any sign of escalation.
At the same time, shifting US tariff policy under President Trump is adding extra uncertainty, fuelling sharp intraday swings and increasing the likelihood of sudden sentiment flips. Liquidity pockets and whipsaws remain common, making disciplined risk management essential.
Gold’s geopolitical premium is still firmly in place, and until tensions ease, short‑term volatility is likely to stay front‑loaded.
M15 Chart: DAX 40 | Is a Powerful Third Wave Still Unfolding?Elliott Wave Perspective
The long-term structure of the DAX 40 continues to align with the characteristics of a developing bullish impulse. Based on the current wave count, the market may still be advancing within a higher-degree Wave III—a phase that often displays the strongest momentum and acceleration within an impulsive cycle.
One of the most important aspects of the current structure is the relationship between the waves of a lower degree. Since Wave (1) and Wave (3) are approximately equal in length, Wave (5) may have a greater potential to become the extended wave. If this scenario develops, the ongoing advance could continue through the completion of its internal subdivisions, allowing the higher-degree Wave III to reach significantly higher levels.
However, a shorter completion scenario remains valid. Wave (5) may complete without a significant extension, causing the broader bullish structure to reach completion earlier than expected. For this reason, the current advance should continue to be evaluated through both its internal wave structure and price behavior.
At present, the larger structure continues to support the possibility of further upside. However, the extent of Wave (5) and the way its internal subdivisions develop will play an important role in determining how far the market may advance toward higher target areas.
As always, this analysis is based solely on the current Elliott Wave Principle structure, Fibonacci relationships, and price behavior. It represents a research-based market perspective rather than a prediction. If the market structure evolves, the wave count and the scenarios presented will be reassessed accordingly.
“Markets do not reveal certainty. Structure reveals probability.”
Mr. Nobody | Elliott Wave Principle 📊
DAX Index
Oct 30, 2023
Three Wave Corrective?!!!
DAX Index
Nov 29, 2023
Diagonal ending in a larger degree of wave????
DAX Index
Jan 25, 2024
The extension of the Bull market
Germany 30
Aug 6, 2024
The idea of extending the DAX bull market
 Long
Long
XAU/USD 04 August 2026 Intraday AnalysisH4 Analysis:
-> Swing: Bullish.
-> Internal: Bearish.
Bias and analysis to remain the same as analysis dated 30 June 2026.
Price did not print bullish CHoCH to indicate bullish pullback phase initiation. Price instead printed a new low followed by a bullish CHoCH
Price is currently trading within and established internal range, however, I will continue to monitor price with respect to depth of pullback.
Intraday expectation:
Price to trade up to either premium of internal 50% EQ, or H4 demand zone before targeting weak internal low, currently priced at 3,942.100.
Note:
Gold remains volatile as tensions between the US, Israel, and Iran keep safe‑haven demand elevated.
Markets are reacting quickly to every headline, while uncertainty around the Fed’s easing path and shifting U.S. policy under President Trump, especially tariffs continues to fuel choppy price action.
For newer traders, the key is simple, stay flexible and manage risk carefully, as fast spikes and sudden reversals are a normal part of the current XAU/USD environment.
H4 Chart:
M15 Analysis:
-> Swing: Bearish.
-> Internal: Bearish.
Analysis and bias remains the same as analysis dated 20 July 2026.
Price has printed according to analysis dated 14 July 2026 where I mentioned price to trade up to either premium of internal 50% EQ, or M15 demand zone before targeting weak internal low, priced at 3,983.545. This is how price printed.
Price has subsequently printed a bullish CHoCH to indicate bullish pullback phase initiation. Price has since printed lower. Depth of pullback has been insignificant, therefore, I will not classify the bearish iBOS, however, I have marked this in red for illustration purposes.
Price has since printed a further bullish CHoCH and once again price is trading within an established internal range, however, I shall again monitor price action with regards to depth of pullback.
Intraday expectation:
Price to trade up to either premium of internal 50% EQ, or M15 demand zone before targeting weak internal low, priced at 3,959.800.
Note:
Gold remains highly reactive on M15 as geopolitical risk continues to drive quick, headline‑led moves.
The tension between the US, Israel, and Iran is keeping safe‑haven demand elevated, with markets still sensitive to any sign of escalation.
At the same time, shifting US tariff policy under President Trump is adding extra uncertainty, fuelling sharp intraday swings and increasing the likelihood of sudden sentiment flips. Liquidity pockets and whipsaws remain common, making disciplined risk management essential.
Gold’s geopolitical premium is still firmly in place, and until tensions ease, short‑term volatility is likely to stay front‑loaded.
M15 Chart: XAU/USD 03 August 2026 Intraday AnalysisH4 Analysis:
-> Swing: Bullish.
-> Internal: Bearish.
Bias and analysis to remain the same as analysis dated 30 June 2026.
Price did not print bullish CHoCH to indicate bullish pullback phase initiation. Price instead printed a new low followed by a bullish CHoCH
Price is currently trading within and established internal range, however, I will continue to monitor price with respect to depth of pullback.
Intraday expectation:
Price to trade up to either premium of internal 50% EQ, or H4 demand zone before targeting weak internal low, currently priced at 3,942.100.
Note:
Gold remains volatile as tensions between the US, Israel, and Iran keep safe‑haven demand elevated.
Markets are reacting quickly to every headline, while uncertainty around the Fed’s easing path and shifting U.S. policy under President Trump, especially tariffs continues to fuel choppy price action.
For newer traders, the key is simple, stay flexible and manage risk carefully, as fast spikes and sudden reversals are a normal part of the current XAU/USD environment.
H4 Chart:
M15 Analysis:
-> Swing: Bearish.
-> Internal: Bearish.
Analysis and bias remains the same as analysis dated 20 July 2026.
Price has printed according to analysis dated 14 July 2026 where I mentioned price to trade up to either premium of internal 50% EQ, or M15 demand zone before targeting weak internal low, priced at 3,983.545. This is how price printed.
Price has subsequently printed a bullish CHoCH to indicate bullish pullback phase initiation. Price has since printed lower. Depth of pullback has been insignificant, therefore, I will not classify the bearish iBOS, however, I have marked this in red for illustration purposes.
Price has since printed a further bullish CHoCH and once again price is trading within an established internal range, however, I shall again monitor price action with regards to depth of pullback.
Intraday expectation:
Price to trade up to either premium of internal 50% EQ, or M15 demand zone before targeting weak internal low, priced at 3,959.800.
Note:
Gold remains highly reactive on M15 as geopolitical risk continues to drive quick, headline‑led moves.
The tension between the US, Israel, and Iran is keeping safe‑haven demand elevated, with markets still sensitive to any sign of escalation.
At the same time, shifting US tariff policy under President Trump is adding extra uncertainty, fuelling sharp intraday swings and increasing the likelihood of sudden sentiment flips. Liquidity pockets and whipsaws remain common, making disciplined risk management essential.
Gold’s geopolitical premium is still firmly in place, and until tensions ease, short‑term volatility is likely to stay front‑loaded.
M15 Chart: XAUUSD: Reading The Liquidity Map Instead Of The Candles Most people read gold by looking at the candles. This is the same chart read by where the volume actually traded.
THE MAP
The heatmap colours each price band by how much volume traded there over the last 300 bars, which on the 15m is roughly three days. Bright bands are where the market spent real activity. Dark bands are where price passed through and left nothing behind.
Three numbers from that map matter more than the candles do.
Point of Control: 4079.813. The single band that absorbed the most volume in the window. This is the market's working idea of fair value.
Liquidity above: 4079.185
Liquidity below: 4047.345
Those are the resting pools, sitting behind obvious highs and lows where stop orders stack up. They are not support and resistance in the usual sense. They are fuel, and price is drawn toward them because there are orders there to fill.
THE THING WORTH NOTICING
The point of control is 4079.813 and the nearest unswept pool above is 4079.185. They are 0.63 apart.
That is not a coincidence worth ignoring. The price the market has agreed is fair and the price where resting orders are stacked are sitting on top of each other. Everything between here and roughly 4080 has one destination, and it has two separate reasons to go there.
Below, the picture is different. The nearest pool sits at 4047.345, with more at 4043.040 and 4020.975 underneath it.
Price is currently at 4069.240, which is below the point of control.
That puts the upside pool about 10 away and the downside pool about 22 away. The nearest objective is roughly half the distance of the one beneath it, and it is the one carrying the double reason.
WHAT THE REST OF THE PANEL SAYS
POC density is 6.3 percent, which is low. Volume is spread thin across the range rather than concentrated in one shelf, so the point of control is a weaker magnet than the line makes it look. This is a market that has not really agreed on anything.
Sweeps read 61 up against 63 down. Effectively balanced, with the faintest tilt toward lows being taken. Nobody is dominating this range.
Volume pressure is plus 0.7 percent, which is neutral in any practical sense.
Current volume is 1.4 sigma below its own average. That is the number that should govern how much weight you give all the others. This reading is being taken in a thin session, and a thin tape produces levels that a real session can ignore entirely.
WHY SWEPT LEVELS ARE MARKED SEPARATELY
Every level marked SWEPT on this chart is a pool that has already been taken. That matters for one reason: a swept pool is spent. The orders behind it have been filled, and the thing that was attracting price no longer exists.
This is where most liquidity analysis goes wrong. People keep drawing the same level after it has already been run. The level did its job. The map moved on.
SCENARIOS, NOT PREDICTIONS
Reclaiming 4079 to 4080 and holding above it turns the level from an objective into a floor, and the map above it opens toward 4087.665 and then the cluster at 4117 to 4120.
Failing there leaves 4047.345 as the working objective below, with 4043.040 immediately beneath it.
Neither of those is a forecast. They are the two places on this chart where there is a mechanical reason for price to travel. Which one gets taken is decided by things this map does not measure, starting with whatever volume arrives when the session actually opens.
INVALIDATION
If price closes above 4080 and holds there for several bars, the read above is finished and the map has to be read again from scratch. The heatmap recalculates on a rolling window, so a level that mattered yesterday may simply not exist tomorrow.
HOW TO USE THIS
Do not trade the pools directly. Use them for two decisions.
Target selection. If you are already long and the nearest unswept pool is close above, that is where the move has a mechanical reason to end. A target beyond it needs a separate argument.
Entry timing. Buying just underneath an unswept pool is expensive, because you are entering directly into the place price is being pulled toward and where it will meet resting supply.
Everything here is measured rather than drawn by hand. The levels are wherever the volume says they are, including when that disagrees with what looks obvious.
Not financial advice. This describes where volume traded, not where price will go. Trade your own plan and manage your own risk. SHIBA | Is the First Major Cycle Ending? A Potential Golden Era SHIBA | Is the First Major Cycle Ending? A Potential Golden Era Ahead?
Based on my personal interpretation of the current Elliott Wave Principle structure, SHIBA may be approaching the completion of its first major corrective cycle. Either the correction has already ended, or the market may require only the completion of the remaining lower-degree waves before a new motive cycle can begin.
This view is based on my wave count, Fibonacci relationships, and the current price structure. According to Elliott Wave theory, once a valid corrective structure is complete, the market is expected to transition into a new motive phase. However, if additional time is still needed for the correction, I would expect that to appear through one of the recognized Zigzag-family structures or another valid corrective combination.
From my current wave count, both the aggressive and conservative trigger levels represent the first meaningful signs that a new bullish phase could be developing. As always, this scenario remains valid only while the market continues to respect the current wave structure and Elliott Wave rules.
If this interpretation proves correct, the larger question will not be whether another correction occurs, but at what degree of the new motive cycle that correction will eventually develop. Only the evolution of market structure can answer that question over time.
For that reason, I currently view the possibility of a Golden Era for SHIBA as a structural scenario rather than a prediction. If the present wave count continues to unfold as expected, the long-term Fibonacci objectives suggest the potential for a much larger bullish cycle than many market participants currently anticipate.
History has repeatedly shown that the market's largest trends are rarely obvious before they begin. The objective of this analysis is not to predict the future with certainty, but to identify the most probable path based on the structure available today.
In my opinion, Elliott Wave Principle is more than a forecasting technique. It is a structural framework for understanding market behavior. Prices may change, but structure follows recognizable rules, and the analyst's role is to interpret those structures objectively as they continue to evolve.
Mr. Nobody
Patterns whisper. I listen. 🎧📊  Long
Long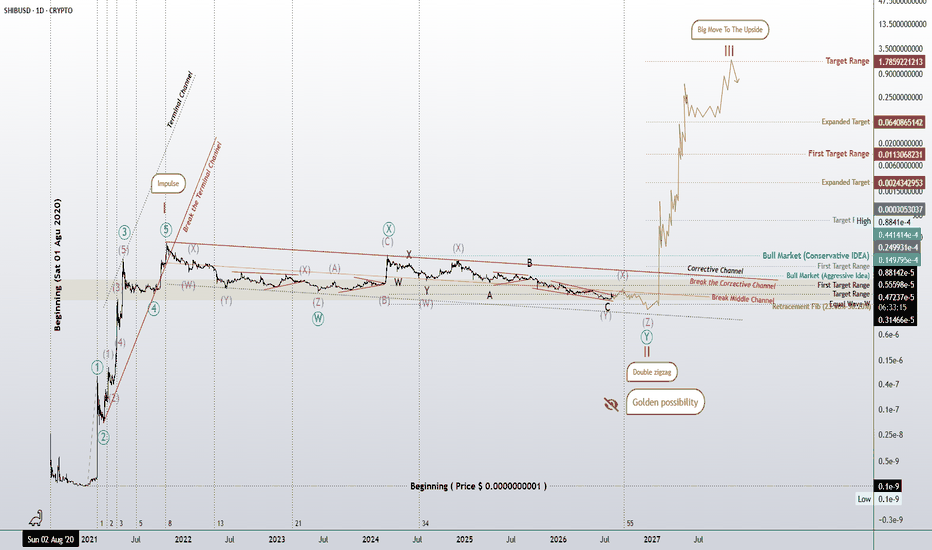
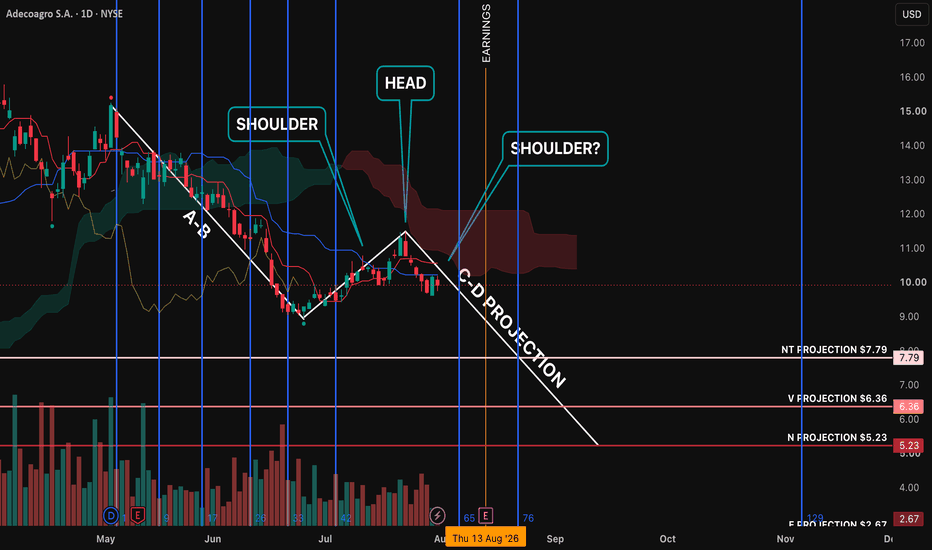
AGRO: Major N-Wave AnalysisThe fundamental unit of price progression in Ichimoku is the N wave. Due to the fractal nature of the market, you have N waves within N waves within N waves.
On this chart, I have shown a major N wave in formation. You can see the minor N waves that have formed around the legs of the major wave. The assumption in Ichimoku is that the final leg of an N wave will form in symmetry and proportion relative to the A-B leg. Do all N waves reach their full potential? No. Like everything else in trading, it's all a matter of probability. Most N waves never see the full E Projection.
Plotting the major wave gives you a longer-term context for shorter-term swing trades. These shorter-term trades get their own price projections and time counts. I have noted the price projections based on the major wave.
Goichi Hosoda used multiple timeframes and Kihon-sūchi counts on his charts. I have plotted out the Kihon intervals for the major wave. Were I to short AGRO, I'd plot new price projections and a new Kihon count. Things get interesting when you have Kihon intervals from different timeframes line up close together. These alignments create probability nodes. If you get a Henka-bi (day of change) at one of these nodes, you got yourself quite a Henka-bi.
The C-D projection is a kind of trend line. Violations of this trend line are usually violations of your thesis. As you can see, AGRO is trading under the cloud (where bearish outcomes have the probabilistic upper hand). You trade with the trend--not against it. Here, you're looking to short segments of the larger N wave's final leg.
With AGRO, you have possible pattern confluence forming with a inchoate head and shoulders. I don't like to see price step across the C-D projection, but if it does here, it might be to form the final shoulder. Pattern confluence can more than make up for the trend-line violation.
If you want to learn how to set up and manage a trade Ichimoku style, check out my new book--Ichimoku: The Holistic System on Amazon (ISBN: 979-8-9912322-1-0).
 Short
Short