Fractal
XAU/USD 19 May 2026 Intraday AnalysisH4 Analysis:
-> Swing: Bullish.
-> Internal: Bearish.
Analysis and bias to remain the same as analysis dated 24 March 2026.
Price has printed a bullish CHoCH to indicate bullish pullback phase initiation.
Price is currently trading within an Established internal range.
Intraday expectation:
Price to react at either premium of 50% internal EQ, or H4 demand zone before targeting weak internal low currently priced at 4,099.125.
Note:
Gold remains volatile as tensions between the US, Israel, and Iran keep safe‑haven demand elevated.
Markets are reacting quickly to every headline, while uncertainty around the Fed’s easing path and shifting U.S. policy under President Trump, especially tariffs continues to fuel choppy price action.
For newer traders, the key is simple, stay flexible and manage risk carefully, as fast spikes and sudden reversals are a normal part of the current XAU/USD environment.
H4 Chart:
M15 Analysis:
-> Swing: Bearish.
-> Internal: Bearish.
Bias and analysis to remain the same as yesterday's analysis dated 18 May 2026.
Price continued bearish, subsequently printing a bullish CHoCH, however, I will apply disctretion and not classify it as such due to the insignificant depth of pullback.
Price has since printed a further bullish CHoCH. I shall continue to monitor price with respect to depth of pullback.
Price is currently trading with an established internal range.
Intraday expectation:
Price to trade up to either premium of 50% internal EQ, or M15 supply zone before targeting weak internal low, currently priced at 4,480.410.
Note:
Gold remains highly reactive on the M15 as geopolitical risk continues to drive quick, headline‑led moves.
The tension between the US, Israel, and Iran is keeping safe‑haven demand elevated, with markets still sensitive to any sign of escalation.
At the same time, shifting US tariff policy under President Trump is adding extra uncertainty, fuelling sharp intraday swings and increasing the likelihood of sudden sentiment flips. Liquidity pockets and whipsaws remain common, making disciplined risk management essential.
Gold’s geopolitical premium is still firmly in place, and until tensions ease, short‑term volatility is likely to stay front‑loaded.
M15 Chart:
EURUSD - Shorting incomingLooking at EURUSD. Looks to be lagging behind USDCHF in terms of getting to our Supply/Demand zone at different points in time.
We have our liquidity to the left that has been run. We are now seeing what looks to be a nice build up of liquidity near our POI so we now just sit on our hands, set our pending order & wait for price to tag us in.
Any questions feel free to ask
USDCAD - Long.. hoping I haven't missed it!Looking at USDCAD. I am really hoping I have not missed this trade. The reason I say this is because if I go down to the 5min TF the actual demand zone is a little bit bigger and actually would/should have been tagged into this position had a realised a little bit earlier.
Will sit on my hands to see how it plays out but really hoping I haven't failed to miss this move
Any questions feel free to ask
GBPUSD - Short - Waiting to be tagged inLooking for potential shorts on GBPUSD. We have a really nice supply zone with liquidity built up just before the zone. Predicting that this will entice the early seller before moving little bit higher to tag our entry before moving lower.
Will see what happens.
Any questions feel free to ask
HOW-TO: Read Markets with Confluence Using MarketMastery SuiteMarketMastery Suite is not a collection of indicators - it is a structured trading framework built around a single principle: no signal means anything in isolation .
Most indicators answer one question in one dimension. Price direction. Volume activity. A support level. Taken alone, each of these is incomplete - and often misleading. MarketMastery Suite is designed to answer all of them simultaneously, and more importantly, to show you when they agree .
The Suite combines six analytical modules - market structure, trailing stop, support & resistance zones, volume & capital flow, trend dashboard, and leverage risk - each built to complement the others. A support zone is more meaningful when structure confirms it. A trend signal carries more weight when volume flow agrees. A breakout is more reliable when the dashboard shows genuine capital commitment behind it.
This is confluence-based market interpretation - not feature stacking.
The modules are documented individually below. But the real edge comes from reading them together.
---
MODULE 1 - Dynamic Support & Resistance Zones
Detects support and resistance zones across multiple structural scales - Micro, Minor, Major, and Macro - derived from Order Blocks and Breaker Blocks identified purely from price action. No fixed lookback or length is required; zones adapt dynamically to real market behaviour.
⯌ Structural Scale Options
Controls which swing levels are used to build the zones. Each scale is constructed from the one below it, creating a natural hierarchy of market structure - from fast-reacting short-term zones to dominant long-term structural boundaries.
Micro Structures - The most recent short-term swings. Fastest to form and most sensitive to near-term price action.
All Micro Structures - Shows the full recent set of Micro swings rather than just the most relevant one.
Minor Structures - Broader swings built from Micro activity. Suitable for intraday to short-term swing context.
Major Structures - Highlights significant turning zones for swing and position traders.
Macro Structures - Dominant market phases relevant for long-term structural bias.
Micro & Minor - Combines Micro swings with Minor context for a fast yet grounded view.
Minor & Major - A balanced mid-to-long-term view. Recommended starting point for most traders.
Multi-Scale (All) - Displays Micro through Major simultaneously for full structural visibility.
⯌ Structural Depth
Controls the sensitivity of swing detection. Default mode operates at standard depth. Incremented mode shifts the entire analysis one level higher, highlighting broader structural swings on the same chart without changing the timeframe.
⯌ Proximity Guide Line
Plots an early warning reference line above a support zone or below a resistance zone - alerting you before price actually reaches the zone. Sensitivity is adjustable independently for each structural scale via dedicated multipliers.
⯌ Zone Behaviour
Bullish zones (support) display in the bullish colour; bearish zones (resistance) in the bearish colour. When a zone is broken, it flips direction automatically - a broken support becomes resistance and is redrawn accordingly. If the flipped zone is subsequently reclaimed, it is removed from tracking entirely.
⯌ Alerts
Alerts fire on: zone breaks, rejections at zone boundaries, retests after a break, proximity line reactions, and proximity zone entries. Each alert includes the relevant price level and ticker context.
---
MODULE 2 - Trailing Stop & Range Detector
A multi-layered trailing stop that communicates directional bias, transition momentum, and ranging conditions through its visual fill - rather than a single line. The fill colour and intensity change with each bias state, making conviction immediately visible.
⯌ Bias States
Bullish Bias - All layers have confirmed an upward flip. Strong directional confirmation.
Bearish Bias - All layers have confirmed a downward flip. Strong directional confirmation.
Potential Bullish Shift - Bias is developing upward but not yet fully confirmed.
Potential Bearish Shift - Bias is developing downward but not yet fully confirmed.
Ranging / Transitioning - No clear directional strength. Market may be consolidating or shifting.
⯌ Volume Context on Bias Change
When a bias transition occurs, a label is plotted at the trailing stop level showing the volume context of the flip - Low, Moderate, High, Very High, or Volume Spike. This helps distinguish high-conviction transitions from low-participation noise.
⯌ Settings
Length controls the lookback period for the trailing stop calculation. Factor adjusts the sensitivity of the stop to price movement. Colours for Bullish, Bearish, and Ranging states are independently configurable.
⯌ Alerts
Fires on every bias transition - Bullish, Bearish, Potential Flip, or Ranging - with volume context included in the alert message.
---
MODULE 3 - Fractal Market Structures
Detects Break of Structure (BoS) and Change of Character (CHoCH) events across four fractal levels - Micro, Minor, Major, and Macro. Swing points are identified using pure price action without fixed lookback windows, allowing structures to adapt naturally to real market behaviour.
⯌ Structure Levels
Micro - Fast-moving structures from recent price fluctuations. Most responsive to short-term shifts.
Minor - Broader structures derived from Micro activity. Offers more reliable trend context.
Major - Identifies significant market turning zones and high-confluence structural shifts.
Macro - The highest-level structures, reflecting dominant market phases across large timeframes.
⯌ BoS vs CHoCH
Break of Structure (BoS) signals potential trend continuation - price has broken a prior swing in the direction of the existing trend. Change of Character (CHoCH) signals a potential reversal - price has broken against the existing trend direction, suggesting the trend may be shifting.
⯌ Break/Sweep Validation
Each structural level has an optional validation mode. When set to Validate, a break that fails to hold is flagged as a Liquidity Sweep rather than a genuine structure break - indicating smart money may have grabbed liquidity before reversing. When set to Bypass, all breaks are accepted at face value.
⯌ ATR Multiplier
Sets the dynamic buffer used to evaluate whether a structure break is sustained or a failed sweep. Each structural level has its own independently adjustable multiplier, calibrated by default to match the typical noise level at that structural scale.
⯌ Market Structure Dashboard
An optional table displaying a chronological log of recent BoS, CHoCH, and Sweep events - including event type, structural level, price at detection, and timestamp. Mobile-Friendly View removes the date/time column for better readability on smaller screens. Max Events to Show controls the list length.
⯌ Fractal Swing Labels
When a fractal display option is enabled, swing points are labelled directly on the chart with symbols sized to their structural scale. Each label's tooltip shows whether the swing is a Higher High, Higher Low, Lower High, or Lower Low, along with the exact price.
⯌ Alerts
Fires on every BoS and CHoCH detection across all enabled structural levels. Liquidity Sweep events trigger a separate alert with context about the failed break.
---
MODULE 4 - Volume & Capital Flow
Three complementary tools for reading participation and capital commitment: Volume Activity Meter, Cumulative Volume Delta, and Open Interest. Each addresses a different dimension of market activity and can be used independently or together.
⯌ Volume Source
Selected Instrument Only uses volume from the current chart symbol. Combined Spot + Perpetual merges spot and perpetual contract volumes for a more complete picture of total market participation. Combined mode is supported for crypto USD/USDT/USDC pairs where both spot and perpetual data are available.
⯌ Volume Activity Meter
Colours each bar based on volume activity relative to its baseline, accounting for time elapsed within the current bar for real-time accuracy. High-activity bullish bars appear in deep green; high-activity bearish bars in deep red. Low-activity bars are highlighted in softer tones to flag weak participation. Extreme volume events are marked directly on the chart.
⯌ Cumulative Volume Delta (CVD)
Tracks the net difference between buying-initiated and selling-initiated volume over time, overlaid on the price chart. Rising CVD alongside rising price confirms bullish participation. Divergence - CVD falling while price rises, or vice versa - may signal weakening conviction and a potential reversal.
⯌ Open Interest (Perpetual Contracts)
Displays the total number of active perpetual contract positions, overlaid on price. Rising OI alongside rising price signals new long positions - bullish conviction. Rising OI alongside falling price signals new shorts - bearish pressure. Falling OI in either direction indicates position closure and potentially weakening momentum.
⯌ Visible Length
Controls how many recent bars are used when plotting CVD and OI over the price chart, allowing you to focus on recent capital flow without affecting the underlying calculations.
⯌ Alerts
Fires when extreme volume activity is detected, with ticker and timeframe context included in the message.
---
MODULE 5 - Trend Snapshot Dashboard
A summary table providing a structured read on trend direction and strength across Price, Open Interest, and Cumulative Volume Delta, alongside real-time capital flow metrics for the current bar. All trend evaluations are anchored dynamically to a structural swing period rather than a fixed length.
⯌ Trend Section
Shows trend direction and strength for Price, Open Interest (when available), and CVD - each evaluated independently over the anchor period. Strength is categorised as Strong, Moderate, Weak, or Noisy. Direction is Uptrend, Downtrend, or Sideways. In mobile view, directional arrows replace the full text descriptions.
⯌ Combined Interpretation
Synthesises the Price, OI, and CVD trend reads into a single market assessment - such as Strong Longs, Short Squeeze, Bullish Divergence, Fragile Rally, or Bearish Reversal. Each state includes a tooltip with a detailed explanation of what the combination of signals implies.
⯌ Flow Section
Shows real-time activity for the current bar across Volume, Volume Delta, and OI Delta - each compared against its baseline and categorised as Spike, Very High, High, Moderate, or Low. Colour intensity reflects relative activity strength.
⯌ Volume Delta Divergence Labels
The Volume Delta cell signals agreement or disagreement between price direction and delta - buyers absorbing a falling bar (▲), sellers absorbing a rising bar (▼), strong aligned pressure (▲▲ or ▼▼), or market indecision (◆).
⯌ Premium Index
For crypto perpetual markets, shows the difference between perpetual and spot pricing. Positive values indicate long positioning pressure; negative values indicate short positioning pressure. Displayed as Long Bias, Short Bias, or Balanced.
⯌ Evaluation Anchor Period
Controls the lookback used for all trend calculations. Options are Minor, Major, and Macro - each corresponding to the most recent detected swing of that structural level. If the selected level has not yet formed, the next available level down is used automatically.
⯌ Evaluation Window
When enabled, highlights the active evaluation range directly on the chart as a regression channel with statistical deviation bands - making the anchor period and trend calculation range visually explicit.
---
MODULE 6 - Leverage Risk Zones
Calculates and displays estimated liquidation levels for both long and short positions based on the selected leverage, entry price, and maintenance margin rate. Assumes isolated margin with full allocation. Estimates exclude fees, funding, and interest.
⯌ Settings
Entry Price - The reference price for liquidation calculations. When set to 0, the current close price is used automatically.
Leverage - The leverage multiplier. Higher leverage moves liquidation levels closer to entry.
Maintenance Margin Rate (%) - The exchange's maintenance margin rate for the relevant trading pair and position size. Default reflects a typical value for general estimation. For accuracy, refer to your exchange's margin tier table and use the rate corresponding to your actual position size.
⯌ What Is Displayed
Long and short liquidation levels are drawn to the right of the current bar with labels showing the exact price, leverage, and distance from current price. When an entry price is specified, margin call warning levels are also displayed, along with an entry label showing current ROI at the selected leverage.
⯌ Colour Logic
When no entry price is set, all levels display in neutral blue. When an entry price is defined, levels colour according to which side is currently in profit - the profitable side in teal, the at-risk side in red.
---
READING THE SUITE AS A FRAMEWORK
Each module answers a different question. The framework answers them together.
Structure (Modules 1 & 3) tells you where the market is - the zones that matter and how price has been behaving around them.
Bias (Module 2) tells you which direction has conviction - confirmed, developing, or absent.
Flow (Module 4) tells you who is behind the move - whether participation and capital are genuinely aligned with the direction.
Dashboard (Module 5) tells you how strong the confluence is - by synthesising trend, flow, and positioning across Price, OI, and CVD into a single, readable read.
Risk (Module 6) tells you where the crowd is exposed - and therefore where price is likely to be pulled.
A setup with structure, bias, and flow all aligned is fundamentally different from one with only one signal firing. The Suite makes that difference visible.
---
ALERTS SUMMARY
All alerts use the "Any alert() function call" type when creating alerts in TradingView. Each module has its own alert toggle in the settings. Active alerts include: S/R zone breaks, rejections, retests, and proximity reactions · Trailing stop bias transitions with volume context · Market structure BoS, CHoCH, and Liquidity Sweep events · Extreme volume activity.
---
TIPS FOR USE
Start with Minor & Major S/R - The default Minor & Major zone setting gives the most balanced structural view for most trading styles.
Use the Evaluation Window - Enabling the regression channel makes the dashboard's anchor period visually explicit, so you always know what range the trend scores are measuring.
Validate major structures - Keep Break/Sweep Validation set to Validate for Major and Macro levels. Micro and Minor can run on Bypass for more responsive signals.
Combined volume for crypto - If trading perpetual contracts, switching Volume Source to Combined Spot + Perpetual gives a more complete read on real participation.
Leverage Risk Zones for confluence - Even without an active leveraged position, entering a hypothetical entry and leverage reveals where crowded liquidation clusters sit on the chart - levels that often attract price.
Mobile view - Enable Mobile-Friendly View in both the Fractal Dashboard and Trend Snapshot settings when viewing on smaller screens.
XAU/USD 18 May 2026 Intraday Analysis H4 Analysis:
-> Swing: Bullish.
-> Internal: Bearish.
Analysis and bias to remain the same as analysis dated 24 March 2026.
Price has printed a bullish CHoCH to indicate bullish pullback phase initiation.
Price is currently trading within an Established internal range.
Intraday expectation:
Price to react at either premium of 50% internal EQ, or H4 demand zone before targeting weak internal low currently priced at 4,099.125.
Note:
Gold remains volatile as tensions between the US, Israel, and Iran keep safe‑haven demand elevated.
Markets are reacting quickly to every headline, while uncertainty around the Fed’s easing path and shifting U.S. policy under President Trump, especially tariffs continues to fuel choppy price action.
For newer traders, the key is simple, stay flexible and manage risk carefully, as fast spikes and sudden reversals are a normal part of the current XAU/USD environment.
H4 Chart:
M15 Analysis:
-> Swing: Bearish.
-> Internal: Bearish.
Price continued bearish, subsequently printing a bullish CHoCH, however, I will apply disctretion and not classify it as such due to the insignificant depth of pullback.
Price has since printed a further bullish CHoCH. I shall continue to monitor price with respect to depth of pullback.
Price is currently trading with an established internal range.
Intraday expectation:
Price to trade up to either premium of 50% internal EQ, or M15 supply zone before targeting weak internal low, currently priced at 4,480.410.
Note:
Gold remains highly reactive on the M15 as geopolitical risk continues to drive quick, headline‑led moves.
The tension between the US, Israel, and Iran is keeping safe‑haven demand elevated, with markets still sensitive to any sign of escalation.
At the same time, shifting US tariff policy under President Trump is adding extra uncertainty, fuelling sharp intraday swings and increasing the likelihood of sudden sentiment flips. Liquidity pockets and whipsaws remain common, making disciplined risk management essential.
Gold’s geopolitical premium is still firmly in place, and until tensions ease, short‑term volatility is likely to stay front‑loaded.
M15 Chart:
AUDUSD - Long now or wait! Looking at AUDUSD - At a nice area of demand. But similar to my other analysis I'm not sure we will hold this area of demand and price might need to go a bit lower before we move higher.
I will give this demand zone every possible chance but lets see what happens.
Any questions feel free to ask!
EURNZD - Time for a reversal? Or wait a bit longerLooking here at EURNZD. We are currently in a nice supply area. Will wait for the lower TF to see if we get some sort of bearish orderflow on the 15min.
However due to how aggressive we have moved into the supply zone I don't really see it holding and fully expect us to go higher into the EXTREME supply zone before potentially getting a reversal.
Any questions feel free to ask!
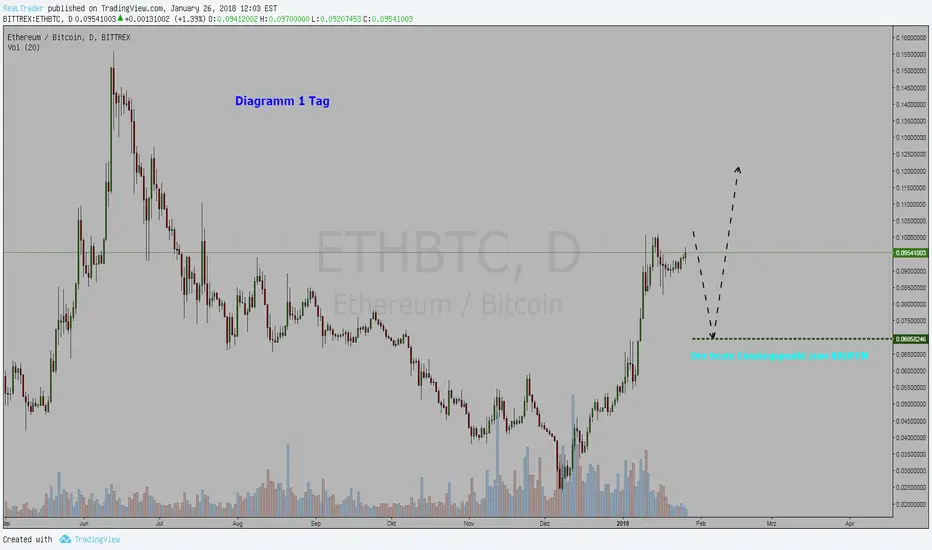
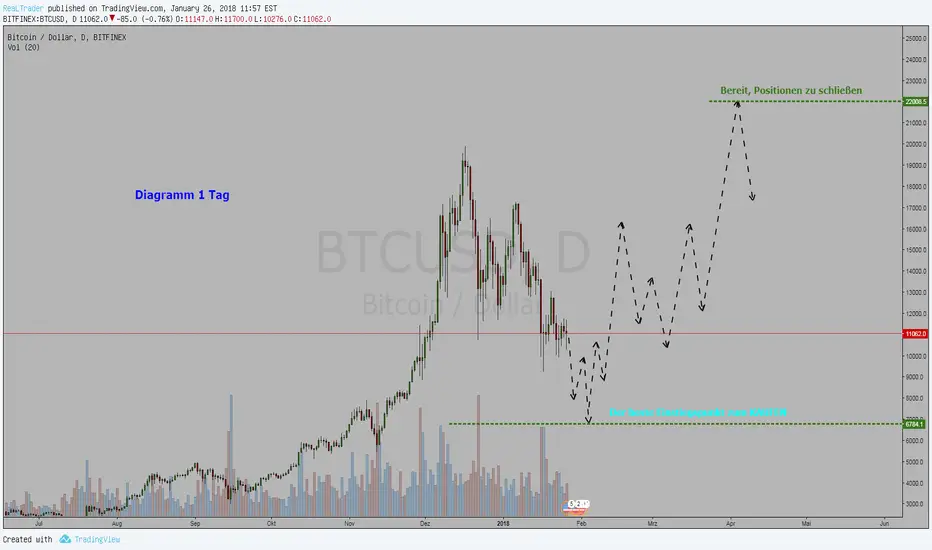
Ethereum BULLISH Fractal Targets 2027This period reminds me of post Covid
Inflation
Rapid repricing in SPX after pullback/crash
Digital transformation (AI)
But where post covid, technologies that enhanced worker autonomy outperformed, this cycle will individual sovereignty technologies outperform? (trading, privacy, sovereignty, stable coins)
Fractal targeting 2027 with fibonacci levels .618 and 1.414 for resistance and targets.
Good luck bulls!
EURCAD | Liquidity Draw Toward HTF Order BlockPrice remains inside a higher-time-frame bullish structure and is now retracing into the 1.60–1.61 breaker block / BC correction zone — a logical refuel area before continuation.
Above, there’s an unmitigated HTF order block at 1.68–1.70 , likely the next draw on liquidity.
That zone should be mitigated before any true macro bearish shift.
Plan
Bias: short-term bullish continuation into 1.68–1.70
Entry: confirmation from the breaker around 1.60–1.61
Stop: below 1.576 (macro invalidation)
Target: 1.68–1.70 (HTF mitigation zone)
– After mitigation, watching for bearish structure to form
The correction still has business above — the HTF OB remains unmitigated.
Let’s see if EURCAD completes the move.
XAU/USD 15May 2026 Intraday AnalysisH4 Analysis:
-> Swing: Bullish.
-> Internal: Bearish.
Analysis and bias to remain the same as analysis dated 24 March 2026.
Price has printed a bullish CHoCH to indicate bullish pullback phase initiation.
Price is currently trading within an Established internal range.
Intraday expectation:
Price to react at either premium of 50% internal EQ, or H4 demand zone before targeting weak internal low currently priced at 4,099.125.
Note:
Gold remains volatile as tensions between the US, Israel, and Iran keep safe‑haven demand elevated.
Markets are reacting quickly to every headline, while uncertainty around the Fed’s easing path and shifting U.S. policy under President Trump, especially tariffs continues to fuel choppy price action.
For newer traders, the key is simple, stay flexible and manage risk carefully, as fast spikes and sudden reversals are a normal part of the current XAU/USD environment.
H4 Chart:
M15 Analysis:
-> Swing: Bearish.
-> Internal: Bearish.
Price has printed according to my alternative scenario analysis dated 12 May 2026 where I mentioned that we have seen a significant narrowing of the internal range. H4 internal structure remains bearish, therefore, it is a probability that price could target strong internal low and print a bearish iBOS.
Price did target strong internal low and printed a bearish iBOS.
Bullish CHoCH positioning, to indicate bullish pullback phase initiation, is denoted with a horizontal blue dotted line.
Price is currently trading with an internal high and fractal low.
Intraday expectation:
Price to indicate bullish pullback phase initiation by printing a bullish CHoCH. Price to then trade up to either premium of 50% internal EQ, or M15 supply zone before targeting weak internal low, currently priced at 4,556.520.
Note:
Gold remains highly reactive on the M15 as geopolitical risk continues to drive quick, headline‑led moves.
The tension between the US, Israel, and Iran is keeping safe‑haven demand elevated, with markets still sensitive to any sign of escalation.
At the same time, shifting US tariff policy under President Trump is adding extra uncertainty, fuelling sharp intraday swings and increasing the likelihood of sudden sentiment flips. Liquidity pockets and whipsaws remain common, making disciplined risk management essential.
Gold’s geopolitical premium is still firmly in place, and until tensions ease, short‑term volatility is likely to stay front‑loaded.
M15 Chart:
USDCHF - Short term Shorts - Long term LongsLooking for short term shorts after this over extended move to the upside. Will now wait for the order flow on the 15min to switch to bearish to catch some pro trend trades before looking for longer term longs at the zones I have marked out.
Any questions feel free to ask
GBPUSD - Short Term Longs. Longer Term ShortsSince this really heavy move to the downside. I will now look to trade the pullback up to the EQ of the leg at the very least before looking for shorts at key supply zones.
I have a couple of supply zones marked out on the 15min TF. If they don't hold and we move higher I will be looking at the extreme zone on the 4HR Timeframe
XAUUSD TradeeFollow price OANDA:XAUUSD 🔽 4694 for sell and 🔼 4710 for buy..
Entry Plan (5-Minute Confirmation):
1️⃣ Execution is only valid if a candle closes with these criteria on the M5 timeframe:
2️⃣ Valid Breakout: At least 80% of the candle body must close outside the level in the direction of the trade.
3️⃣ Momentum: Body size must be at least 2x the shadows (No Doji or Pin bars).
4️⃣ Relative Size: Body should be average-to-large compared to recent candles.
5️⃣ The trade is valid on Pollback: If the price breaks through the breakout level again, you can enter the position with the confirmation candle as mentioned.
Position Management:
🔴 Stop Loss (SL):
Placed behind the last swing prior to the breakout.
🟢Take Profit (TP):
Target levels are marked numerically on the chart.
🔼Note: Only take trades with a minimum 1:1 Risk/Reward ratio. Use Risk-Free (Break-even) for higher targets.
⚠️Risk Warning: Please follow proper risk management if you enter based on this analysis.
💬 Join the Discussion: I'd love to hear your thoughts on this setup in the comments! For direct inquiries or more details, feel free to message me in private chat.
XAU/USD 14 May 2026 Intraday AnalysisH4 Analysis:
-> Swing: Bullish.
-> Internal: Bearish.
Analysis and bias to remain the same as analysis dated 24 March 2026.
Price has printed a bullish CHoCH to indicate bullish pullback phase initiation.
Price is currently trading within an Established internal range.
Intraday expectation:
Price to react at either premium of 50% internal EQ, or H4 demand zone before targeting weak internal low currently priced at 4,099.125.
Note:
Gold remains volatile as tensions between the US, Israel, and Iran keep safe‑haven demand elevated.
Markets are reacting quickly to every headline, while uncertainty around the Fed’s easing path and shifting U.S. policy under President Trump, especially tariffs continues to fuel choppy price action.
For newer traders, the key is simple, stay flexible and manage risk carefully, as fast spikes and sudden reversals are a normal part of the current XAU/USD environment.
H4 Chart:
M15 Analysis:
-> Swing: Bearish.
-> Internal: Bullish.
Bias and analysis to remain the same as analysis dated 12 May 2026
You will note how price has targeted the strong internal low but failed to close below. This is in-line with alternative scenario of my analysis.
Price has printed according to my analysis dated 08 May 2026 where I mentioned price to trade down to either discount of 50% internal EQ, or M15 demand zone before targeting weak internal high, priced at 4,764.905.
Price has printed a bullish iBOS and subsequently a bearish CHoCH, to indicate bearish pullback phase initiation.
Intraday expectation:
Price to trade down to either discount of 50% internal EQ, or M15 demand zone before weak internal high, currently priced at 4,773.575.
Alternative scenario:
We have seen a significant narrowing of the internal range. H4 TF internal structure remains bearish, therefore, it is a probability that price could target strong internal low a print a bearish iBOS.
Note:
Gold remains highly reactive on the M15 as geopolitical risk continues to drive quick, headline‑led moves.
The tension between the US, Israel, and Iran is keeping safe‑haven demand elevated, with markets still sensitive to any sign of escalation.
At the same time, shifting US tariff policy under President Trump is adding extra uncertainty, fuelling sharp intraday swings and increasing the likelihood of sudden sentiment flips. Liquidity pockets and whipsaws remain common, making disciplined risk management essential.
Gold’s geopolitical premium is still firmly in place, and until tensions ease, short‑term volatility is likely to stay front‑loaded.
M15 Chart:
[Episode 3 - Stranger Trader] NZDUSD- buy posibilityEpisode 3 of a Stranger Trader
Trade number 3 - Waiting for confirmation - 0W - 0L - Total R : 0.
NZDUSD is eyeing a bullish reversal on the 1-hour chart.
This setup suggests a pullback opportunity in the uptrend, targeting lower support levels with approximately 1:2 risk-reward.🔥
Entry between 0.59336 – 0.59351 for a long position (entry from current price with proper risk management is recommended). Target at 0.59643
Set a stop loss at bellow 0.59210 , yielding a risk-reward ratio of approximately 1:2.
Monitor for confirmation.
📝 Trade Setup
🎯 Entry (Long):
• 0.59336 – 0.59351
(Entry with market order is valid with proper risk & position sizing.)
🎯 Target:
• 0.59643
❌ Stop Loss:
• Bellow 0.59210
⚖️ Risk-to-Reward:
• ~ 1:2
💡 Your view?
Let me know in the comments what is your opinion on this trade.