Head and Shoulders
CAD/JPY - LongThe market did not move the way I wanted to last week. This week I am anticipating CADJPY to swipe out the liquidity left on the 30min chart. I want it to reject the 50 day moving average. Followed by a bearish candle stick pattern. A morning star candle stick pattern preferably. I will be aiming for all time high. I have a strong feeling that I will be holding this trade atleast 2/3 days if it gives me the signal
NVDA - Head & Shoulders? Not So Fast.At first glance, NVDA's chart looks textbook bearish - a clean Head & Shoulders pattern forming between mid-2025 and early 2026, with a well-defined neckline near ~ $170.
But here's the catch: the neckline is just 15$ above the Major Support at $156!!
While the broader market - including the S&P 500 - underwent a significant correction, NVDA held its ground above major support. The Right Shoulder formed, price dipped... and bounced. That's not a weakness. That's relative strength.
The H&S is
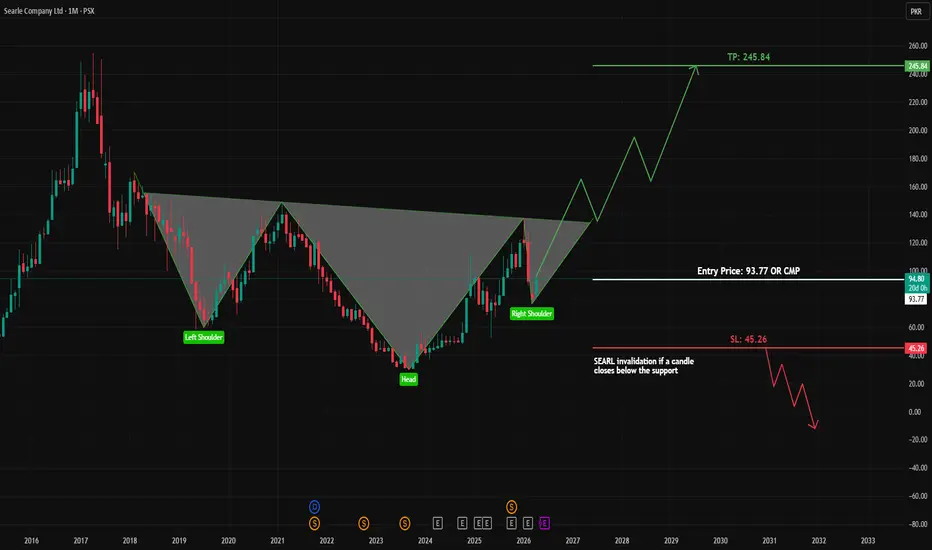
SEAL | Potential Inverse Head & Shoulders Formation#SEAL is currently exhibiting early signs of a bullish reversal, with price action forming an Inverse Head & Shoulders pattern.
At present, the right shoulder is in development, placing price in a potential early entry zone (CMP) ahead of a possible breakout.
Key Highlights:
• Developing Inverse Head & Shoulders structure
• Right shoulder forming — early positioning opportunity
• Gradual reduction in bearish momentum
• Breakout above neckline may confirm trend reversal
Strategy:
A long po
Anthem Biosciences Ltd – Cup & Handle BreakoutChart Analysis
Anthem Biosciences is forming a classic Cup & Handle pattern, indicating a potential trend reversal → bullish continuation.
Rounded bottom (Cup) shows accumulation phase
Smaller pullback (Handle) shows weak profit booking
Price is now breaking out of a strong demand zone (₹680–₹710)
This structure signals bullish momentum building up.
Key Levels
Demand Zone: ₹680 – ₹710
Breakout Level: ₹720 (closing basis)
Current Price: ~₹720
Target: ₹750 – ₹770
Stop Loss: ₹670
Trade Setup
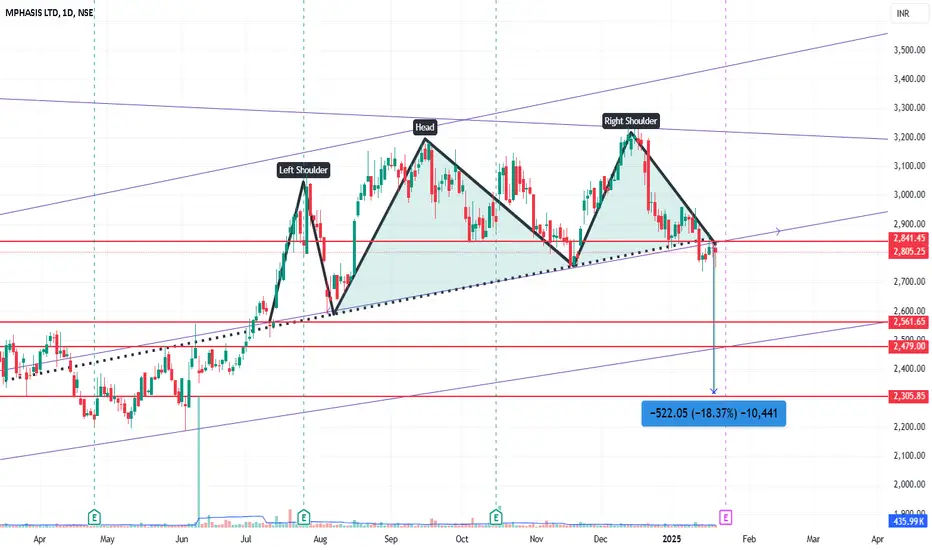
Head and shoulder pattern activatedMphasis, trading near 200 EMA
HNS pattern is activated
results on 23 jan'24.
the trend suggests weak results
the stock can correct from 15 to 20 % after results,
keep a watch on this counter for big upmoves
if stock closes above 2840, then the pattern may reverse and the downfall can be arrested.
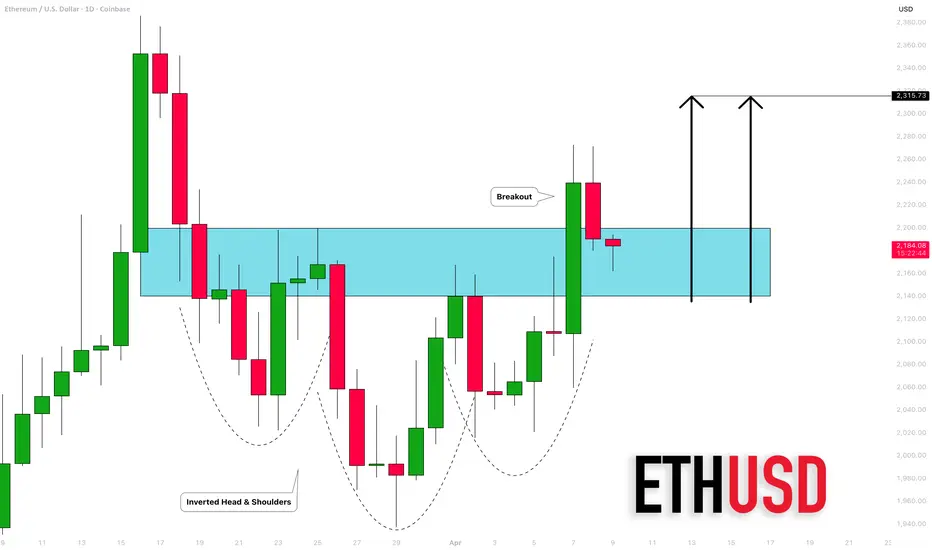
ETHEREUM (ETHUSD): Very Bullish Pattern
Ethereum formed an inverted head & shoulders pattern on a daily time frame.
Its neckline was broken this week.
The broken structure turns into a potentially strong support.
A bullish wave may initiate from there.
Goal will be 2315
❤️Please, support my work with like, thank you!❤️
I am part of Trade Nation's Influencer program and receive a monthly fee for using their TradingView charts in my analysis.
Not sayin’ it’ll happen, def couldWhen you zoom out on the Meta chart and move to the weekly, downturn with H&S pattern is undeniable, a retrace to 437 area on 50% fib retrace would be first target, 350ish at .618 I will get long. I am not short…. But if this starts moving my way after the shooting star dojo from yesterday, I will dip my toes…. Not financial advice
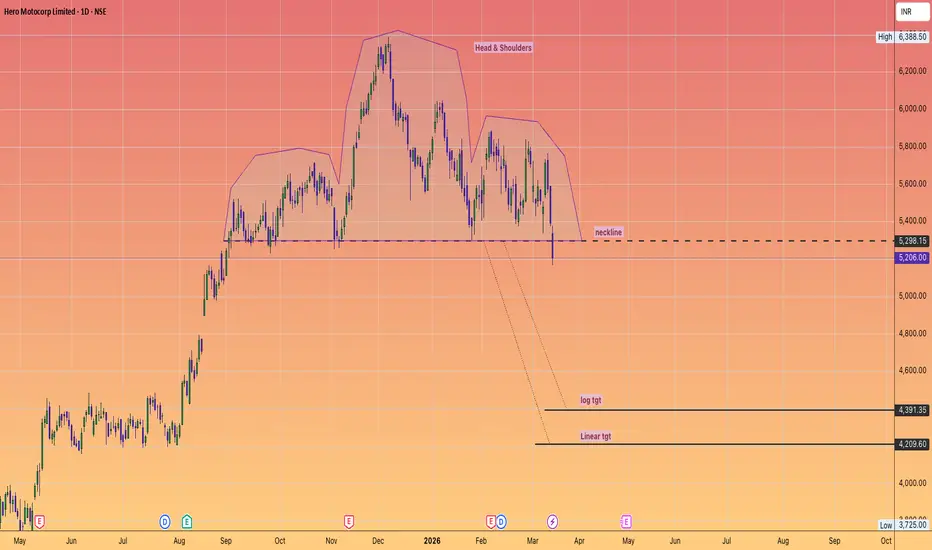
$HeroMotoCorp: Hero to Zero...📉 📉 📉
(not literally :) )
⚠️⚠️⚠️
The chart doesn't lie. After a massive run-up, Hero has formed a clear Head and Shoulders pattern—one of the most reliable bearish reversal signals in technical analysis.
The Neckline: The crucial support at 5,298 has been breached.
The Breakdown: We are now seeing a decisive daily candle closing below that neckline, turning what was once "floor" into "ceiling."
Why the "Hero" Narrative is Faltering (Bearish Drivers):
Market Share Erosion: While Hero domina
BITFARMS can trade back under a dollar!Head and shoulders top!
#BITF is violently levered to Bitcoins price action.
Halving economics!
Dilution Risks!
The market is voting that the current hash price and capex profile do not justify the prior spike.
Miners with weaker balance sheets or higher energy costs always get punished the hardest, especially post halvening as the price of the token starts falling.
NAS100, Similar Trend But A Year ApartLast year when Trump annouced tarrifs ,whole world went into shock and we have witnessed some of the biggest drops in capital markets around the world. That drop bottomed out after breaking below SMA 200, then formation head and shoulders pattern toward new highs.
Now this time, similarity of US IRAN war with Liberation Day is uncanny. Nas dropped and closed below SMA200, head and shoulder pattern formed and now above SMA 200. Timing of these two events are also similar and alligned with long t
ULong
Key Levels to Watch Next Week.After reviewing the chart, price action shows a clear sweep of the weekly support, followed by a strong recovery candle that closed back above the level. This reclaim has formed an inverted Head & Shoulders structure, with the neckline already broken. Price is now stabilising just above the 21‑SMA at 4495.29, signalling early bullish momentum returning into the market.
From a structural standpoint, the market has shifted from liquidity‑taking behaviour into accumulation, which often precedes a c
Nifty Head and Shoulder Break out in 15 min chartNifty has break out head and shoulder pattern on 15 min chart also retest and reverse. Nifty can reach to 23450 for which SL can be kept below 22550.
I am not a SEBI registered research analyst or investment advisor. The information provided is for educational and informational purposes only and should not be considered financial advice. All investments involve risk, including the loss of principal. Please consult a qualified financial advisor before making any investment decisions. I may or m
H&S AMP bearish H&S ?
Target round number 300
Fib at 300 ish is 0.5 of the run up
Equity market decline → lower AUM → lower fees (BIGGEST DRIVER)
AMP’s revenue is heavily tied to assets under management (AUM). If markets fall, client portfolios shrink → fee income drops directly.
Net client outflows / weaker flows in asset management
Recent data already shows slowing deposits and rising withdrawals, which signals weakening demand and directly reduces revenue.
Declining investor sentiment (cash bal
$RISE (Infinity Rising) Bullish Case Here is a combined chart of the COPI token (pre migration) and the RISE token (post migration) It is obviously way too early to be saying this is an inverse head and shoulder pattern. But given the strong fundamentals of this project: a project that has been building something meaningful and unique over the last few years, and the many catalysts they have on the horizon, it is highly likely this project will make new highs and if price rejects off the neckline then there is a huge opportunity to
H&S AMPBearish
Equity market decline → lower AUM → lower fees (BIGGEST DRIVER)
AMP’s revenue is heavily tied to assets under management (AUM). If markets fall, client portfolios shrink → fee income drops directly.
Net client outflows / weaker flows in asset management
Recent data already shows slowing deposits and rising withdrawals, which signals weakening demand and directly reduces revenue.
Declining investor sentiment (cash balances falling)
A drop in brokerage cash balances (~3% QoQ) suggests cl
SAMBHAV STEEL TUBESSambhv Steel Tubes Ltd. (CMP ₹107.38, NSE: SAMBHV)
A mid‑cap steel tubes manufacturer, incorporated in 2002, engaged in cold rolling and integrated steel projects. Headquartered in India, the company has emerged as a fast‑growing player in the steel sector.
Promoter Holding (Dec 2025): Majority stake retained by promoters, ensuring strong control and direction.
FY22–FY26 Snapshot
Revenue Growth: CAGR >25% over FY22–FY26; Q2 FY26 revenue ₹5,801 Cr (+83% YoY). → Good
Net Profit: Q2 FY26 PAT ₹30
EUR/JPY - Short This is my 4th and final idea for the week. This is not my favourite as I can see a lot of obstacle on the way down to the price target I would be aiming for. However, I will still be keeping a close look at this pair. If i can get my entry signal at 1.84 I will be targeting 200 pips to the downside towards 1.82
GBP/CAD - Short I believe that this trade requires a bit more time to fully cook. I want it to break the neckline confidently and pull back to turn it into a resistance. I will be anticipating for a particular candle stick patters as my entry signal before targeting the price at 1.81 my entry would be around 1.84
EUR/USD - Short I believe whilst Trump remains in power despite peoples personal opinion about him. He is a great business man and on the fundamental aspect of things I highly doubt that he will be allow the dollar the weaken. On a technical basis the EURO is weak and this pair will continue to move bearish targeting the 1.14 ps level