FLNC 1W: Energy doesn’t disappear - it accumulates.Fluence Energy builds large-scale battery storage systems for modern power grids. While markets debate rates and cycles, Fluence operates in infrastructure - the backbone of renewable integration. Batteries are designed to store energy. Right now, the chart is testing whether price can store demand.
On the weekly timeframe, FLNC completed a full impulse toward 33.5 and is now in a deep corrective phase. Price has reached the 14.8–16.2 Confluence Zone — not just a level, but a structural decision point.
This zone combines:
• 0.618 Fibonacci retracement of the entire impulse (14.94)
• MA100 as dynamic support
• Historical accumulation range
• Descending trendline intersection
• Volume profile node
Five factors. One area.
The decline is occurring without expansion in volume. ADX is falling, indicating weakening downside momentum rather than acceleration. There is no evidence of panic distribution. This looks like pressure on support - not a structural collapse.
Now the asymmetry:
Below 14.5 → probability shifts toward 0.786 retracement near 9.89.
Above this zone → upside rotation toward 18.49, then 22.03, with 33.5 as the broader recovery level.
The risk/reward profile begins to favor buyers precisely in this range. Not higher. Not later. Here.
Fundamentally, scale remains intact:
TTM revenue ~2.55B.
Last quarter ~475M.
Q2 2026 revenue estimate ~640M.
EPS estimate −0.15 - profitability remains volatile as the company continues scaling.
This is infrastructure, not hype. Infrastructure moves in cycles — but cycles begin at compression points.
The 0.618 zone is not just a retracement. It’s a decision.
No fluff, just alpha 🚀  Long
Long
Market Learning Series - Chapter 2Trading vs Investing – Understanding The Difference
Two friends began their stock market journey on the very same day. Both started with ₹1,00,000 in capital, opened trading accounts, and were excited by the opportunities that the markets seemed to offer. At first glance, their paths looked identical, but their approach towards the market was completely different. The first friend treated the market as a constant source of action. He checked stock prices every few minutes, tracked market news throughout the day, and reacted emotionally to every movement on the screen. A green candle made him optimistic, while a red candle immediately made him anxious. His focus was largely on short-term price fluctuations and finding opportunities to benefit from them. The second friend was equally interested in the market, but his perspective was different. Instead of focusing on what a stock might do today or tomorrow, he spent his time understanding businesses, industries, and long-term growth potential. He was less concerned about daily ups and downs because his attention was on where a company could be several years into the future. As the years passed, both friends gained experience and valuable lessons from the market. One spent most of his time attempting to capture short-term price movements, while the other focused on identifying businesses capable of creating wealth over the long term. Neither approach was inherently right or wrong. The key difference was that each understood his objective before committing capital. One approached the market as a trader seeking opportunities in price movement, while the other approached it as an investor seeking long-term value creation. Understanding that distinction helped both align their decisions with their goals and avoid the confusion that often traps beginners.
━━━━━━━━━━━━━━━━━━━
🔍 What Is Trading?
Trading is the act of buying and selling financial instruments over a shorter time frame.
The goal is to benefit from price movements.
A trader may hold a position for:
• A few minutes
• A few hours
• A few days
• Sometimes a few weeks
Traders focus on:
• Price action
• Volume
• Market structure
• Momentum
• Risk management
For traders, timing often plays an important role.
━━━━━━━━━━━━━━━━━━━
📈 What Is Investing?
Investing involves buying assets with the intention of holding them for a longer period.
Investors focus on:
• Business quality
• Earnings growth
• Industry potential
• Competitive advantages
• Long-term value creation
Investors are usually less concerned with short-term price fluctuations.
Their focus is on long-term wealth creation.
━━━━━━━━━━━━━━━━━━━
⚠️ Where Many Beginners Get Confused
A common mistake is entering a trade and calling it an investment when it starts losing money.
Imagine buying a stock for a short-term move.
The stock falls.
Instead of accepting that the trade did not work, the trader suddenly decides to "hold it for the long term."
The original plan changes.
The risk increases.
The decision becomes emotional.
This is where confusion often begins.
━━━━━━━━━━━━━━━━━━━
💡 Key Differences
Trading:
• Shorter time horizon
• Focus on price movement
• Requires active monitoring
• Relies heavily on risk management
Investing:
• Longer time horizon
• Focus on business growth
• Requires patience
• Relies on long-term conviction
━━━━━━━━━━━━━━━━━━━
🎯 STWP Learning Note
Trading and investing are both valid approaches.
The problem begins when we mix the two without a clear plan.
A trade should have a trading plan.
An investment should have an investment thesis.
Confusing one for the other often leads to poor decisions.
━━━━━━━━━━━━━━━━━━━
📌 Final Thought
Before entering any position, ask yourself one simple question:
"Am I trading this, or am I investing in it?"
The answer should be clear before the trade is placed—not after the market moves against you.
 Education
S&P 500 Daily Chart Analysis For Week of May 29, 2026Technical Analysis and Outlook:
The Index has achieved a notable accomplishment this week by completing the Outer Index Rally at 7,600.
At present, the market is poised for an In-Force retracement, with a targeted support level at Mean Support 7,520. There exists a potential extension to Mean Support at 7,451, as the downward momentum is likely to restrict opportunities for profit-taking.
Forecasts for the upcoming trading sessions indicate that the Index will remain focused on retesting the completed Outer Index Rally at 7,600 following the conclusion of the In-Force retracement movement. Subsequently, the attention will shift towards the Next Outer Index Rally at 7,707 and, in the longer term, to the Next #2 Outer Index Rally at 7,815. Bitcoin(BTC/USD) Daily Chart Analysis For Week of May 29, 2026Technical Analysis and Outlook:
This week's trading session has seen a significant decline in Bitcoin's value. Current market analysis indicates that Bitcoin is trading between the Mean Resistance level at $74,000 and the Mean Support level at $72,500. There is strong anticipation that the price will continue to decline, ultimately reaching its primary target, known as the Inner Coin Dip, set at $71,400.
Market participants should be aware that once the Inner Coin Dip at $71,400 is reached, a rebound is expected, likely pushing the price back up to the $72,500 resistance level (the inverse of Mean Support). There is also a possibility of extending further to the Mean Resistance at $74,000.  Short
Short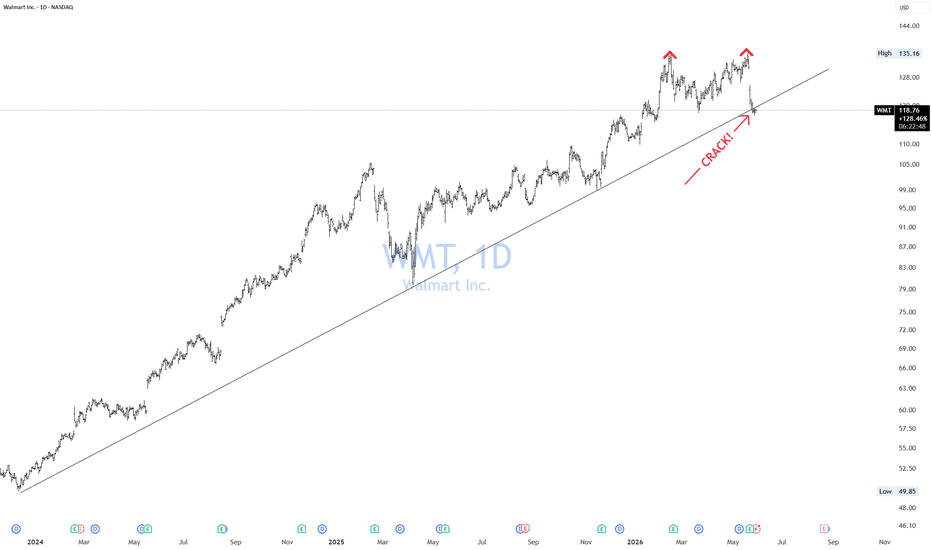
 Long
Long
Will Amylyx Survive Its Radical Rare Disease Pivot?Macroeconomics and Economics
Amylyx Pharmaceuticals faces a brutal macroeconomic landscape today. Rising interest rates heavily punish pre-revenue biotech companies. Investors demand rapid clinical catalysts to justify massive capital expenditures. Amylyx maintains a cash runway expected to last into 2028. This financial buffer provides crucial breathing room for clinical trials. The company currently burns significant cash on late-stage research. First-quarter 2026 R&D expenses reached nearly $27.6 million. Executives must navigate these tight economic constraints carefully. The rare disease market offers massive pricing power upon approval. However, securing FDA approval remains an incredibly expensive endeavor. Economic volatility forces Amylyx to aggressively prioritize high-yield drug candidates.
Geopolitics and Geostrategy
Global geopolitical tensions heavily influence biotech supply chains. Amylyx sources critical active pharmaceutical ingredients from international markets. Strategic competition between superpowers threatens these delicate trade routes. The company must secure domestic manufacturing capabilities immediately. Geostrategists view pharmaceutical independence as a vital national security asset. Furthermore, international regulatory agencies complicate the global approval process. Amylyx must align its clinical data with diverse global standards. The European Commission recently granted orphan drug designation to AMX0035. Navigating these fragmented geopolitical landscapes dictates future market access. Strategic global partnerships remain essential for long-term survival.
Industry Trends, Company Culture, and Innovation
The biopharmaceutical industry demands constant, radical innovation. Amylyx aggressively embraces a pipeline-driven corporate culture. Following the Relyvrio setback, leaders discarded stagnant operational mindsets. They now foster a highly agile, science-first environment. The company actively pivots against mainstream industry trends. While competitors develop GLP-1 agonists for weight loss, Amylyx innovates differently. They advance avexitide as a first-in-class GLP-1 receptor antagonist. This bold contrarian approach targets post-bariatric hypoglycemia (PBH). A resilient company culture refuses to accept clinical defeat. Innovators continuously test new modalities to solve rare diseases. This fearless culture directly drives their expanding clinical pipeline.
Business Models, Management, and Leadership
Amylyx executives deploy a highly focused, risk-adjusted business model. Management targets niche markets possessing significant unmet medical needs. They recently completed enrollment for the pivotal Phase 3 LUCIDITY trial. Effective leadership requires ruthless capital allocation and strategic foresight. Leaders aggressively acquired avexitide to diversify their clinical portfolio. They actively leverage FDA Breakthrough Therapy Designations to accelerate timelines. Strong management teams recognize that single-drug business models fail. Therefore, they develop multiple pipeline assets simultaneously. They advance AMX0035 for Wolfram syndrome alongside their PBH treatments. This diversified leadership strategy protects shareholders from isolated clinical failures.
Science, Technology, and High-Tech
Scientific breakthroughs define the future of Amylyx Pharmaceuticals. The Phase 2 HELIOS trial recently delivered highly encouraging data. AMX0035 demonstrated objective improvements in pancreatic beta cell function. Furthermore, patients experienced better glycemic control and visual acuity stabilization. High-tech continuous glucose monitoring systems validate these clinical findings accurately. Researchers target endoplasmic reticulum stress and mitochondrial dysfunction simultaneously. This dual-mechanism approach synergistically prevents catastrophic cellular neurodegeneration. Advanced biomarker analysis accelerates the discovery of these novel therapies. Scientists leverage high-throughput screening to identify new drug candidates rapidly. Relentless scientific rigor forms the absolute foundation of their enterprise.
Cybersecurity and Patent Analysis
Digital transformation introduces severe cybersecurity threats to clinical data. Hackers aggressively target proprietary trial results and patient health records. Amylyx invests heavily in zero-trust cybersecurity architectures to protect assets. A deep patent analysis reveals a robust intellectual property moat. The company constantly files patents protecting unique chemical formulations. They secure exclusive rights to their GLP-1 antagonist mechanisms. Competitors cannot legally replicate their proprietary blend of sodium phenylbutyrate. Strong patents guarantee absolute market exclusivity upon commercial launch. Protecting these assets ensures long-term profitability in the biotech sector. Intellectual property remains the ultimate currency for modern pharmaceutical innovators.  Long
Long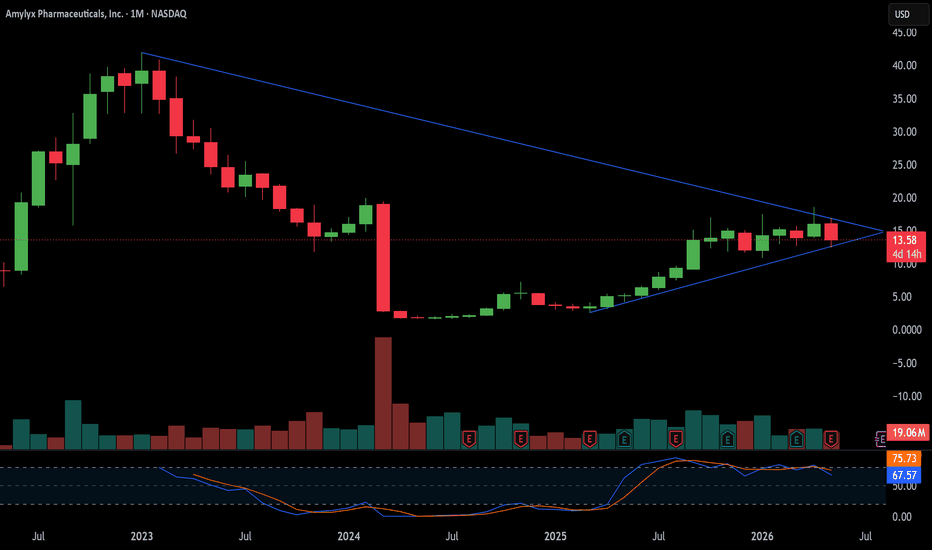
S&P 500 Daily Chart Analysis For Week of May 22, 2026Technical Analysis and Outlook:
The Index has demonstrated a double whammy in this week's trading activities. Initially, it achieved our established Mean Support target of 7,341, after which the S&P 500 rebounded and retested our Key Resistance level at 7,501.
At present, the Index is positioned in a downward trading mode, targeting a decline to the Mean Support level of 7,425, with a potential extension to the Mean Support at 7,341, as downward momentum continues to prevail.
In anticipation of the forthcoming trading sessions, market projections indicate that the S&P 500 Index will maintain its focus on reaching the Outer Index Rally target set at 7,580. Bitcoin(BTC/USD) Daily Chart Analysis For Week of May 22, 2026Technical Analysis and Outlook:
In the most recent trading session, Bitcoin has demonstrated a significant pullback. Current market analysis shows that the cryptocurrency is trading downward toward the Mean Support level of $73,800. Should this downward trajectory persist, Bitcoin will decline further to its primary target, the Inner Coin Dip, which is positioned at $71,400.
Market participants must acknowledge that upon completion of the Inner Coin Dip at $71,400, there will be upward momentum to the initial main target, the Mean Resistance at $73,800. Furthermore, there exists the possibility of extending this rebound to the subsequent Mean Resistance level at $77,500. Simple Math that separates profitable investors from the crowdMost newbie traders are looking for a "secret indicator," the perfect entry point, or a signal. But the truth is, the biggest and most consistent money in the market is made not by successful trading, but by basic math and discipline.
1. The Main Mistake Most Traders Make
People try to: earn 100% in a month, constantly catch the bottom and top, trade too often. But market math works differently.
A professional thinks:
"How can I preserve my capital and steadily increase it over the years?"
That's why one of Warren Buffett's main rules is: "Never lose money."
Because after a drawdown of ~10%, the math starts to work against you.
2. Why are losses more dangerous than they seem?
If your deposit has fallen:
by 10% → you need to earn 11% to recover
by 20% → you need 25%
by 50% → you need to make +100%
Here's a simple visualization: it's very easy to lose half your capital in one trade, but to get it back, you need to double it. Making 100% of your deposit is no easy task for many experienced investors.
That's why: stop losses, position size, risk control are more important than the "perfect entry."
3. The power of compound interest - the eighth wonder of the world!
Compound interest is when profits start generating new profits. For example:
If you invest $10,000 at 20% per year:
in 1 year → $12,000
in 5 years → ~$24,800
in 10 years → ~$61,900
in 20 years → ~$383,000
The most interesting thing is: at first, the growth seems slow... but then the curve literally starts to shoot up exponentially, and anyone can achieve this with discipline and time.
4. Why did Buffett become super-rich in old age?
Many people think Warren Buffett got rich through some insider trading. But the main reason is his age and compound interest. According to Investopedia: Buffett started investing as a child,
and more than 99% of his wealth was formed after age 50. This is the effect of compound interest. He didn't try to "blow up his deposit in a month," jump from asset to asset, or anticipate every crisis.
He simply bought strong assets, held them for decades, and let time do the work.
5. Real-World Examples of Large Growing Assets
If you look at history: Apple NASDAQ:AAPL , Microsoft NASDAQ:MSFT , the S&P 500 VANTAGE:SP500 , Nasdaq IG:NASDAQ , Bitcoin BITSTAMP:BTCUSD – the highest returns on capital weren't achieved by those who traded constantly.
But those who decided long ago to start investing in technology and solid businesses, aggressively bought up drawdowns and greedily sold profits,
survived volatility and held positions for years. Even the standard S&P 500 index has historically shown strong growth over long periods thanks to reinvestment and time.
6. Basic Math of a Profitable Trader
Many don't understand one simple thing:
You can be right on just 40% of your trades... and still make money. For example:
risk per trade = 1%, profit = 3%
Then:
6 losing trades = -6%
4 winning trades = +12%
Result: +6% even with more mistakes.
That's why professionals love the risk/reward ratio:
RR=RiskReward
The market isn't a "who's right" competition. It's a game of probabilities and risk management.
Result
Big money in trading and investing is usually built not on hype, not on emotions, not on constant trading.
But on three simple things:
1) Risk control
2) Consistent returns
3) Time + compound interest
On my Tradingview channel, you'll find many educational posts that will improve your trading efficiency.  Education
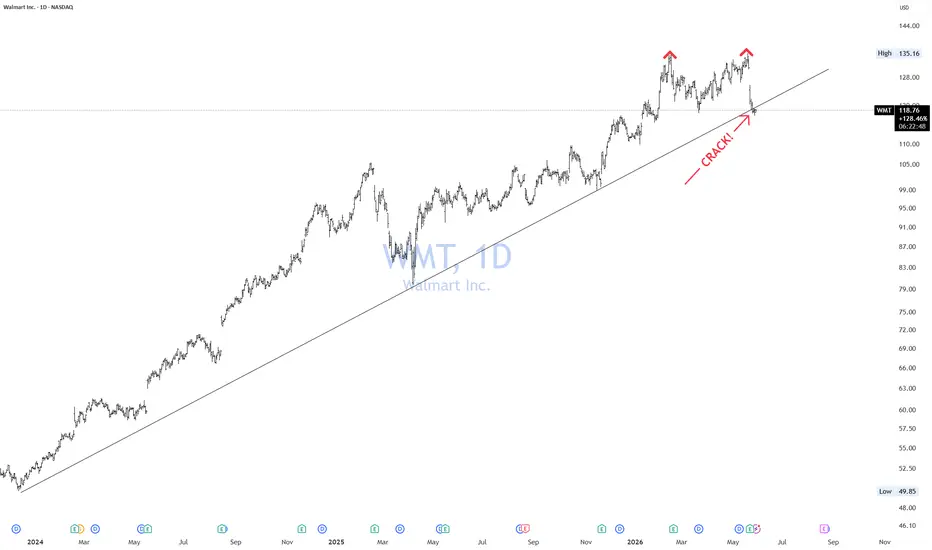
NDX Top Short! or.. Wait For Crack! Update 2NDX Bottom short has come!
Whenever initiating a TOP SHORT in an established uptrend, the likelihood that it keeps running is obviously high. That's why you wait to add to the bottom CRACK! short. To give you a nice cost average. In this case, the price rose 9% addding now gives you a -4.5% drawdown Peanuts for a Macro short trade.
It is important to remember that the -4.5% drawdown applies to the entire position. However, the -9% draw down was only on half of the position. A much smaller amount, for example
An initial $5,000 Short position -10% = -$500
Adding the 2nd $5,000 for a total of $10,000 = $9,500
The -$500 loss is Peanuts! As a whole. More than acceptable.
Why implement this strategy?
It gives you some protection against a rapid downside move to hedge your portfolio or as a standalone trade, it gives you a nice cost average trade without guessing when should you add. It's all right there on the screen, triggering trade signals on the fly.
On the flip side, if you wanted to Short wait for the bottom Crack, which is a much safer play.
Hence the title "Top Short! or.. Wait For Crack!"
Lastly, there is a lot more MEAT ON THAT BONE FOR THE SHORTS!!
Moving on, there is no more doubt or speculation as to the extent of Trump's corruption in markets in this recent move up. The ethics filing shows the US president was extremely active in this recent move up. DUH!
All it takes is a couple of phone calls to Goldman Sachs, JPM, Blackrock etc.. for him to say DON'T SELL or I will come after you with the SEC, and that's it. Simple. He has done it with collages, media, law firms etc... so its no big secret
The problem is he can't do this forever. So be prepared when the rubber band snaps back to reality. It's gona hurt!
As I have been warning GTFO and STFO! Cash is a position.
If you enjoy the work: 👉 Drop a solid comment. Let’s push it to 7,000 and keep building a community grounded in raw truth, not hype.
 Short
Short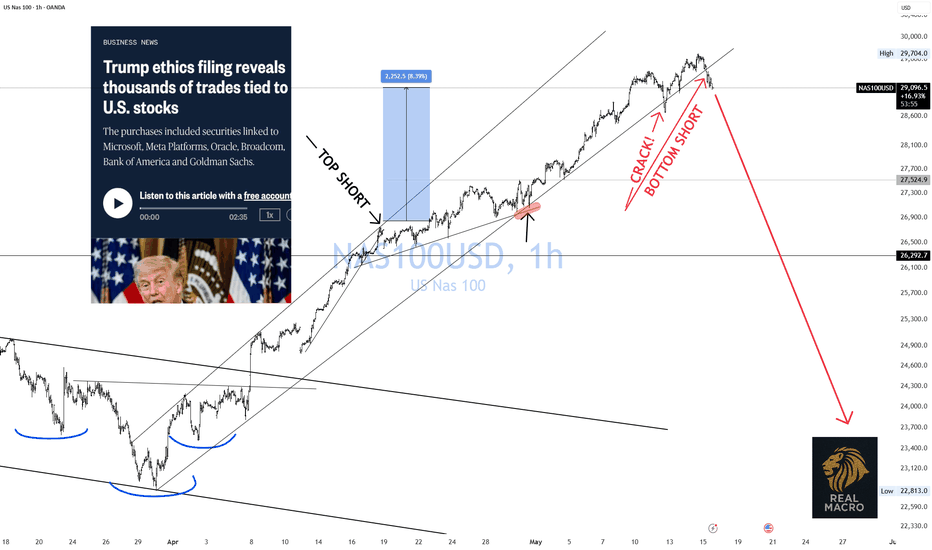
CrowdStrike +40% Here is What Changed (and What Didn’t)Back on March 16th, I broke down why I was bullish on CrowdStrike from a long-term perspective. Since then, the stock has moved up roughly 40%.
In this update, I walk through what I’m seeing now, why that move matters, and how I’m thinking about the opportunity going forward.
The key point: while the long-term thesis around AI, cybersecurity, and recurring revenue remains intact, this recent move has largely happened without a new earnings cycle. That suggests a shift in sentiment and expectations, not necessarily a major change in fundamentals.
I break down how that impacts the current risk-reward, and why a great company doesn’t always mean a great entry point.
If you’re interested in understanding how to think about valuation, sentiment, and timing in high-growth stocks, this is a useful case study.
The information provided in this video is for informational purposes only and does not constitute investment advice, financial advice, or a recommendation to buy or sell any securities. Investing involves risk, including the potential loss of principal. Always conduct your own due diligence.

S&P 500 Daily Chart Analysis For Week of May 15, 2026Technical Analysis and Outlook:
The Index has completed the Outer Index Rally by reaching a level of 7,440. During this rally, a new Key Resistance level was established at 7,501. Presently, the Index is trading at the Mean Support level of 7,401, with a potential extension to the Mean Support at 7,341 as upward momentum resumes.
Looking ahead to the upcoming trading sessions, projections suggest that the Index is well-positioned to maintain its upward trajectory, with the next target for the Outer Index Rally set at 7,580, followed by a subsequent target of 7,815. Bitcoin(BTC/USD) Daily Chart Analysis For Week of May 15, 2026Technical Analysis and Outlook:
In the current trading session, Bitcoin has shown notable gyrations, oscillating between the completed of the Inner Coin Rally at $82,700 and the substantial Mean Support level at $79,300. This fluctuation highlights the dynamical essence of the Bitcoin market.
Currently, market analysis suggests that Bitcoin is likely to trend downward towards the Mean Support level of $78,000. Should this downward trajectory continue, Bitcoin could decline further to the next Mean Support level at $75,800.
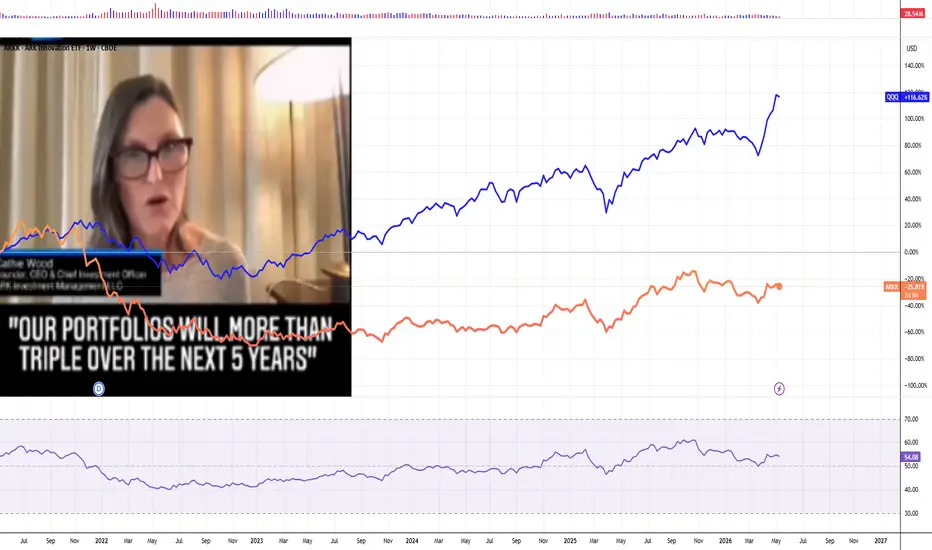
Contrarily, it is important to recognize the potential for a reversal in momentum from Mean Support $79,300. Should bullish market forces re-emerge, Bitcoin could retest the completed Inner Coin Rally at $82,700 via the Mean Resistance level of $82,200. This scenario emphasizes the price action between support and resistance levels in forecasting Bitcoin's price trading movements. 21st-Century Scammers, or How Cathie Wood Fed Everyone Fire WoodIn the modern financial arena, the loudest conviction often commands the most attention, yet the market remains stubbornly indifferent to how well a story is told. Cathie Wood, the face of innovation-led investing, famously declared that her portfolios would more than triple over a five-year horizon. However, as of May 2026, the divergence between that bold prophecy and the cold reality of the charts is impossible to ignore.
The visual contrast is staggering. As shown in the attached chart, the blue line representing the NASDAQ:QQQ — a benchmark for Nasdaq-100 innovation—has consistently outpaced the orange line of the ARKK ETF. While QQQ has delivered robust compounding, ARKK has struggled through a cycle of volatility and significant underperformance, leaving retail investors to wonder where the promised alpha went.
The disparity is compounded by the structural reality of the fees. Investors in QQQ benefit from a lean expense ratio of approximately 0.20%, allowing more of their capital to work within the market. In contrast, those tethered to ARKK have paid a premium 0.75% expense ratio for returns that have failed to justify the cost.
This situation illustrates a classic 21st-century trap: the conflation of vision with performance. In the age of social media, an articulate pitch can generate billions in inflows, but those inflows do not equate to asset appreciation. When the "Fire Wood" settles, we are left with the basic arithmetic of investing: hype is a fleeting commodity, but management fees are permanent.
For the trader or long-term investor, the lesson is clear: verify the narrative against the net-of-fee performance. While Wood continues to forecast a "Goldilocks" boom, the performance gap between her funds and standard index trackers suggests that being a visionary is secondary to being a prudent allocator.
Why position size is more important than entry point? Most beginners are looking for the perfect indicator or secret strategy, but the problem is almost always another position size.
It is the position size that decides:
📈 will you survive the drawdown?
📉 can you restore the deposit?
Will you remain calm during a market decline?
Position size is one of the key strategic risk parameters.
One deposit - 3 different results:
Let's imagine that Alberto has $10,000.
And he heard about the digital currency Bitcoin.
He buys $$$ and, according to the classics of the genre, BTC begins to fall by -30%!
Now let's see what happens with different $$$ position sizes.
Position size in BTC
10% of the deposit ($1000) - final loss -3% of the deposit
50% of the deposit ($5000) final loss -15% of the deposit
100% of the deposit ($10,000) final loss -30% of the deposit
Now the most important thing that many people forget.
To restore:
loss of 3% → need to earn only 3.1%. Isn't it a big difference?
To restore a loss of 15% → already 17.6%.
And to make up for a loss of 30% → 42.8% is required.
And if you lose 50% of your deposit, you need to make +100% just to return to zero!
This is why many traders spend years “guessing the market” but still lose money.
The problem is not in the analysis, but in the incorrect volumes per transaction.
This is why it is so important not to get into the drawdown and set a stop loss.
Why do newbies constantly oversize their positions?
The person is confident in the transaction -> enters with too much volume -> receives the usual correction -> emotionally closes the position. Although the idea could be correct.
This is especially critical in crypto, where volatility is much higher than the stock market.
The main principle of profitable trading:
A newbie always thinks: “How much will I earn?” and is already thinking about how he will spend this profit.
Professionals think: “How much am I willing to lose as much as possible if I turn out to be wrong?”
This is why many people use the risk rule:
Risk per trade:
beginner → 0.5–1%
experienced → 1–2%
aggressive → above 2%
That is, if you risk 1% per trade, you need to get 100 losing trades in a row to destroy your deposit. It's complicated. Now compare it with a person who enters the entire deposit with leverage. One trade is enough to lose everything.
That is, if you only have $1000, investing all of it in any asset is very risky.
But if you have $100,000, then you can safely invest $1000 in dozens of projects.
How to find strong deals and not lose your deposit?
Newbies think:
“If the deal is good, you need to enter with a large volume.”
Professionals do the opposite:
“Even the best deal may not work out.” And this is the key difference in thinking.
Case Study, let's say:
Deposit = $10,000
Risk per trade = 1%
Maximum loss = $100
You find an entry into COINBASE:BTCUSD with a 5% stop.
You set take profit at least +10+15%.
Then the position size should be:
Position Size=1%:5%=20% of capital.
That is: you open a position for only $2,000 and if the stop is triggered → you will lose $100.
the deposit will remain almost untouched.
This is exactly how traders who live from the market for years work.
Why taking a little risk makes more money
It sounds strange, but small losses = large net capital gains
Because: the deposit is saved, the psychology is more stable, there is no panic, you can survive a series of stops, the effect of compound interest appears.
Most big players do not survive because they guess the market better.
They just can stay on the market in any weather.
A simple system for beginners
Save for yourself:
✅ Never risk more than 1-2% per trade
✅ Calculate position size from stop, not from confidence
✅ The higher the volatility, the smaller the position
✅ Don’t go all out, even in strong setups
✅ First think about protecting your existing capital - only then think about profit.
Totally:
In trading, the winner is not the one who guesses right most often.
The winner is the one who is ready for drawdowns, controls the risk, and does not destroy the deposit with one mistake.
Correct position size: saves capital, preserves psychology, allows you to grow steadily in any market! On my channel you will find even more educational posts that will improve your trading efficiency.  Education
 Short
Short