Short
Short

 Long
Long
 Long
Long
 Long
Long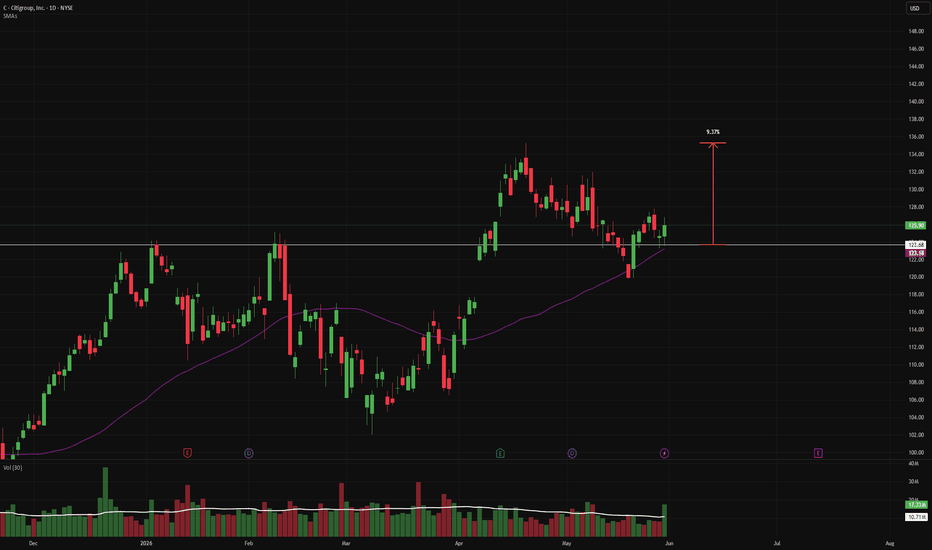
 Long
Long
Everyone is waiting for the dip… May 2026What if it never came?
A few days ago the idea of an approaching resistance “ Expect resistance 86-87k - May 2026 ” was published. It is clear from various quarters this is interpreted as a forecast “crash” event prediction as and when resistance is tested. An event that’ll cover long orders to those that panic sold around $65k now looking to capture a missed opportunity.
Here's the thing, resistances can be broken. Resistances, just like support, can fool the market. The trade or opportunity only makes sense after confirmation. Never guess, never fall victim to the popular narrative. Right now the popular narrative remains, a mega crash is coming.
Let’s be honest, had you bought instead of sold around 65k, you’d not be reading this post. It would be entirely irrelevant. Instead participants now face the worry of a resistance confirmation that might never come. What if price action slices straight through resistance? Continues with higher lows?
Why would it do that?
Very simple. The market is driven by emotion. We all know this resistance is here. Emotional participants emptied their pockets at the lows during the panic. They gladly sold every last Sat to shrewd investors for cheap, my favourite price. Participants now repeat this activity with their alt tokens. Latterly there are folks sitting in cash waiting for an even larger drop to levels like $50k, or even $40k as they’ve been promised. Well, that’s not going to happen.
How do I know this?
Look left. (That includes the influencers!)
On the above 9 day chart you’ll see the 100 day Rolling Moving average. Since Bitcoin began life way back in 2011, you would see new highs print with each confirmation of support on the 100 RMA.
Price action has confirmed support on the 100 RMA @ $65k. That is the only reason I now know that lower lows are very improbable. The herd has missed out, and the FOMO is quietly building, as is the frustration. Perhaps price might double bottom on the RMA, as it has done in the past. Treat that opportunity as a gift horse should it happen.
But a stock market crash is coming!
The “ Sell in May come back another day - The Truth 2026 ” is also receiving much pushback despite an 86% probability the stock market closes higher in the next 6-8 months from now at the same time most continue to call for a crash. The market it seems refuses to oblige.
But Warren Buffet’s cash position is the largest it’s ever been!
The inbox has shown that message once or twice. “He sits on huge cash position waiting for the crash!"
One of the most mis-informed statements flying around influencer circles at the moment is Warren Buffet maintains a large cash position. Two things:
1. Every trader and investor should maintain a cash position larger than their tradable portfolio. It is the core facet to good risk management. It’s how I sleep at night.
2. He’s not all in cash, he’s mostly long treasury Bonds. That’s not cash, that’s cash with a guaranteed rate of return as interest.
In other words, he’s reduced his risk during a period of increased volatility.
But recession!! Recession is coming.
Another popular narrative doing the rounds. For the majority of folks, recession = bear market.
That’s a reasonable assertion with one problem, the facts do not support such a point of view. The truth is much more compelling. Overlay historical recessions during the business cycles of the last 100 years and you’ll learn the stock market does not care. Think about it, the conflicts (Plural?!) America is engaged in is often used as a narrative to explain why an economic downturn is coming, which will crash the market. The evidence is, the stock market does not care. As a matter of fact, recessions are one of the greatest wealth transfers you’ll have in your lifetime. While everyone else panics, you act decisively.
Have said this before elsewhere…. if you wish to participate in this transfer, be invested.
Read “ S&P 500 to 10,000 inside the next 4 years - December 2025 ” for a detailed breakdown why the stock market is going make much higher moves.
Bis später!
Ww
=========================================================
Disclaimer
This post reflects personal market opinions and interpretations of historical price action. It is not financial advice, investment advice, or a recommendation to buy or sell any asset. Markets are inherently unpredictable and all investments carry risk, including the potential loss of capital. Past performance, historical probabilities, and technical indicators do not guarantee future results. BTC — First Weekly 200 MA Test. High-Confluence Long ZoneBTC — First Weekly 200 MA Test of the Cycle. High-Confluence Long Zone.
Bias: Long / Accumulation | Timeframe: Weekly | Asset: BTC (ETH correlated)
Bitcoin is down over 50% from the October 2025 all-time high and now sits in the single most technically significant zone of this entire cycle. I've taken an aggressive entry here. This is a high-confluence area — not a guarantee — and I'm treating it with defined risk.
Why This Zone Matters
1. First Weekly 200 MA test since the bull market breakout. This is the headline. Price has not tested the Weekly 200 MA since breaking out — first touches of this MA after a multi-year breakout are historically where major reversals begin.
2. Testing 50% of the prior all-time-high consolidation — a major High Volume Node. This is a heavy liquidity zone that can act as a support/resistance flip. Significant prior trading activity here means real buyers are likely to defend it.
3. Monthly 50 MA test (potential — may be front-run). Adds confluence on the higher timeframe.
4. Early Weekly RSI bullish divergence — forming, not confirmed. Being honest: this is developing, not complete. I want to see it confirm.
5. Crowded shorts + negative funding = squeeze fuel. This is the part most people miss. Open interest is near record highs with persistently negative funding rates. Short positioning is historically crowded — and crowded trades rarely resolve quietly. This is the strongest near-term tailwind for a bounce.
The Other Side — Why I Could Be Wrong
I'm not pretending this is a clean buy. The backdrop is genuinely heavy:
Worst monthly ETF outflows of 2026 — institutions are de-risking faster than price alone suggests.
Mt. Gox distributions + corporate selling adding supply pressure.
Whales distributing while retail accumulates — historically a bearish combination.
Fed rate decision on June 17 is a binary catalyst. A dovish surprise fuels a sharp recovery; a hawkish one puts the lower targets in play. My entry sits right on the level that a hawkish outcome targets — eyes open on that.
In 2017–2018, BTC eventually broke through the 200 MA before bottoming. That can happen again. If this zone fails, the next accumulation levels I'm watching are 60K, 54K, 48K — and for the deep-bear scenario, 32K.
My Trade
Entry: 61,600 (aggressive)
Stop Loss: 58,400
Expectation: A relief move of 10–25% after a sell-off of this size
Risk: ~5.2%
How I'm Managing It
This is a defined-risk bounce trade in a confluence zone, not a bottom call. If the zone holds and shorts get squeezed, the move can be sharp. If it breaks, I'm out at my stop and reloading lower.
Not financial advice. Do your own research. Manage your risk — never all in, never size beyond what a loss would let you sleep through.
 Long
Long
Lloyds (LLOY) Daily: Swing Setup Guided by 17/72 EMA Alignment &We are introducing an educational swing trading model on Lloyds Banking Group plc ( LSE:LLOY - LSE) utilizing a robust dual-EMA framework on the Daily (1D) chart to capture the next structural expansion leg.
For this study, we are tracking momentum using the **17-period Exponential Moving Average (17 EMA - red line)** and the **72-period Exponential Moving Average (72 EMA - blue line)**, which serve as highly reliable trend filters for medium-term swing positions.
### Structural Framework & Technical Indicators:
* **The Dynamic Realignment:** After an extended period of consolidation and noise throughout April and May, the technical picture has cleared. The faster **17 EMA (98.52)** has successfully established a bullish cross above the slower **72 EMA (98.22)**.
* **The Support Cluster:** Price action is currently consolidating healthily right above this dynamic baseline, validating that institutional buyers are actively defending the newly formed accumulation floor.
### The Trade Execution Matrix:
The long position tool on the chart outlines a highly disciplined breakout execution framework:
1. **The Entry Trigger:** The setup activates upon a clean daily break above the recent local structural top at **102.40**, signaling an official expansion drive.
2. **The Risk/Reward Parameters:** A precise **2.0X Risk/Reward ratio** is projected:
* **Stop Loss:** Firmly set at **98.80** (3.60p / 3.516%), structurally protected right below the dual-EMA support cluster.
* **Full Target (2.0X):** Projected at **109.60** (7.20p / 7.031%) into historical liquidity pools.
### Professional Position Management Blueprint:
To eliminate emotional bias and secure portfolio equity against sudden market rotations, we apply a strict fractional exit playbook:
* **Partial Take-Profit 1 (1.0X):** Upon reaching a 1:1 risk-to-reward ratio, exactly **50% of the position size** is closed to lock in localized gains.
* **The Break-Even Adjustment:** Simultaneously, the Stop Loss for the remaining 50% is trailing-shifted directly to the **entry point (102.40)**, establishing a completely risk-free position.
* **The Target Run:** The remaining half of the asset is left running to capture the maximum mathematical expansion toward the ultimate **109.60** target wall.
Let the market bring the volume and trigger the structural levels before initiating risk.
---
📊 **ProData Chart** | By Rogerio Zaglia
*Swing Trading Architecture, Technical Analysis & Risk Management.*
⚠️ **Disclaimer:** For educational and informational purposes only. This study does not constitute investment advice or trading recommendations. Past performance is not indicative of future results.  Long
Long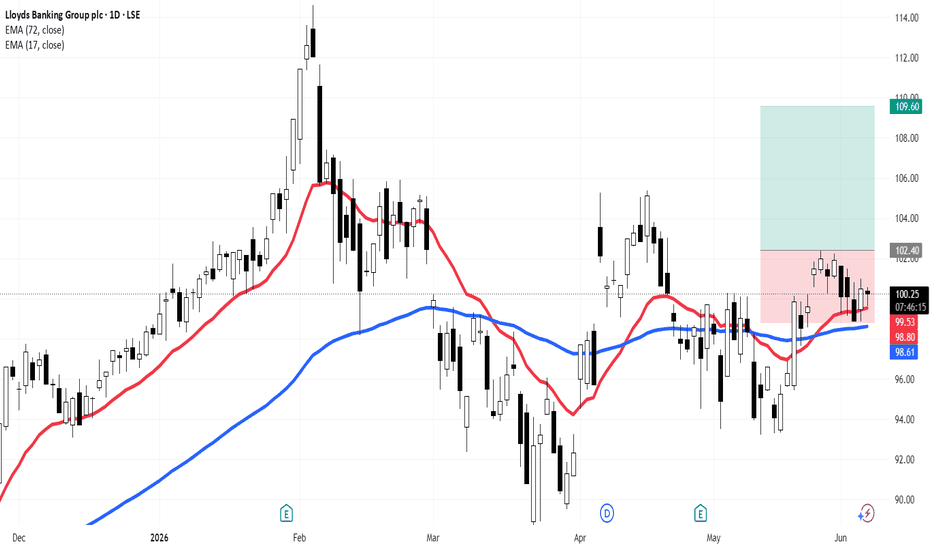
XAUUSD — Bearish Continuation Below EMA StructureBearish Continuation Below EMA Structure, Sell View Remains Preferred
Fundamental Analysis
Gold is still trading in a sensitive macro environment as market participants continue to watch the U.S. dollar, Treasury yields, and upcoming U.S. economic data. Any shift in Fed expectations may create short-term volatility, especially around major liquidity zones.
For now, the broader market tone does not show enough strength to confirm a clean bullish reversal on gold. As long as the U.S. dollar remains supported and gold fails to reclaim key technical resistance, upside reactions may still be treated as corrective pullbacks within a bearish structure.
Technical Analysis
On the 4H chart, XAUUSD remains under pressure below the EMA 34, EMA 89, and EMA 200. This confirms that the current trend structure is still bearish, with sellers maintaining control below the main dynamic resistance area.
The EMA 34 and EMA 89 are acting as near-term resistance, while the EMA 200 remains above price as a stronger trend filter. Every recent recovery attempt has been rejected before a clear bullish structure could form. This suggests that the market is still respecting the downside bias.
The descending trendline from the previous swing highs also continues to cap the upside. Price has not broken this trendline with conviction, and as long as gold remains below both the trendline and EMA cluster, the preferred approach is to wait for sell opportunities on pullbacks rather than chasing entries at the lows.
From an ICT perspective, the key area to watch is the bearish order block around 4,518 - 4,542. This zone is aligned with the EMA resistance area and sits below the buy-side liquidity resting near 4,592 - 4,608. If price pulls back into the order block, sweeps liquidity, and then rejects, it may offer a cleaner bearish continuation setup.
Current sell-side liquidity is located around 4,487 - 4,470. A clean bearish displacement below this area could open the way toward 4,443, followed by the deeper liquidity zone around 4,360 - 4,320. If downside momentum expands further, the larger low around 4,102 remains a major liquidity level to monitor.
Important Key Levels
Near resistance: 4,518 - 4,542
Bearish order block: 4,518 - 4,542
Buy-side liquidity: 4,592 - 4,608
EMA resistance area: 4,526 - 4,595
Current sell-side liquidity: 4,487 - 4,470
Short-term support: 4,443 - 4,440
Next downside target zone: 4,360 - 4,320
Major low liquidity: 4,102 - 4,101
Trading Scenario
Main Sell Scenario
Entry: 4,518 - 4,542
Stop Loss: 4,565
Take Profit 1: 4,487
Take Profit 2: 4,443
Take Profit 3: 4,360
Sell Condition
The preferred setup is to wait for price to pull back into the 4,518 - 4,542 resistance zone, where the bearish order block, EMA resistance, and trend structure are aligned.
A sell setup becomes more valid if price shows bearish rejection from this area, such as a failed breakout, long upper wick, bearish engulfing candle, or a sweep above short-term buy-side liquidity followed by a return below the order block.
Selling directly at the lows is less attractive because price is already close to short-term sell-side liquidity. A pullback into resistance would offer a cleaner structure and better risk-to-reward conditions.
Alternative Scenario — Invalidation Only
This is not the main buy view. However, if gold closes strongly above 4,565 on the 4H chart and holds above the EMA/order block area, the current sell setup should be considered invalid. In that case, price may extend its recovery toward 4,592 - 4,608 before a new structure forms.
Entry Conditions
Do not enter only because price touches a level.
Wait for confirmation from price action before taking any position.
The best sell condition is a pullback into resistance followed by clear rejection.
If price breaks and holds above 4,565, the bearish setup is no longer valid.
Risk management is essential because gold can create sharp liquidity sweeps before choosing direction.
Overall, the main view remains bearish while XAUUSD trades below EMA 34, EMA 89, EMA 200, and the descending trendline. The cleaner plan is to stay patient and wait for a pullback into resistance before looking for sell confirmation.
Do you share the same bearish view on gold, or are you waiting for stronger confirmation before taking a position?  Short
Short
Rare earths, rare profits - long at 27.02 Went long this one today at 27.02. The whole rare earth producer sector is a buy for me today. I chose USAR because its daily returns for me have been the best of any, though I am long two others as well.
USAR is in a 1 year uptrend, and above its 20, 50 and 200 day moving averages. Historically, pullbacks in this scenario have resolved quickly and with significant moves. The longest any trade took to resolve in the last 13 months here was 10 trading days, but more than half closed in 3 days or less. Obviously, no guarantees here, but 8 of the last 10 trades have also produced wins of 5% or greater. You can understand why I like this setup, given those numbers.
There is some support but it is 20% below the current value, so I would not consider it relevant at this point.
If the trade continues beyond tomorrow, adding and subtracting additional lots tactically will be a key part of the management of the position. Profit target 1 is +6% intraday. Otherwise, I will close the lot at the close of the first trading day where the trade would close at a profit.
As always - this is intended as "edutainment" and my perspective on what I am or would be doing, not a recommendation for you to buy or sell. Act accordingly and invest at your own risk. DYOR and only make investments that make good financial sense for you in your current situation.
 Long
Long
 Long
Long
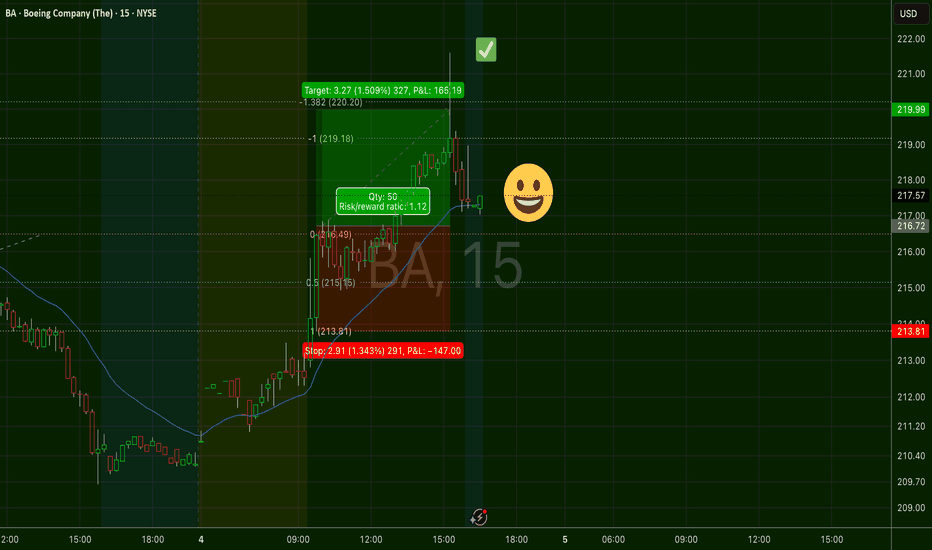
Day 71 of 90 — Buyers Failed Where Confirmation Was Needed🛡️ Day 71 of 90 — Buyers Failed Where Confirmation Was Needed
XAUUSD | M15 | Sentinel Core | Sentinel Structure | Sentinel Companion
Situation
• Gold recovered strongly from the **4,425–4,435 demand zone**.
• Buyers formed a Higher Low (HL).
• Price reclaimed the EMA21 and EMA50.
• Buyers rallied into the major resistance zone near **4,512–4,515**.
👉 Recovery created opportunity, but resistance required confirmation.
What This Chart Shows
• Buyers successfully protected support.
• A Higher Low formed near the demand zone.
• Price pushed toward the previous Higher High area.
• Buyers failed to break resistance.
👉 Structure improved, but confirmation never arrived.
🟦 Phase 1 — Demand Zone Reaction
• Price reacted strongly from **4,425–4,435**.
• Buyers entered aggressively.
• Selling pressure weakened.
• The first Higher Low formed.
👉 Strong support can create strong reactions.
🟩 Phase 2 — Structure Development
• Price reclaimed the EMA21.
• Price reclaimed the EMA50.
• Buyers maintained control during pullbacks.
• Momentum shifted temporarily bullish.
👉 Higher Lows show improving structure.
🟨 Phase 3 — Current Market Condition
• Buyers reached the major resistance zone near **4,512–4,515**.
• Price tested the previous Higher High area.
• Buyers failed to create a new Higher High.
• Sellers immediately stepped back into the market.
• Price returned toward support around **4,472–4,475**.
👉 A Higher Low without a Higher High is not confirmation.
Key Lesson
Many traders become bullish as soon as they see a Higher Low.
The problem?
A Higher Low is only the first step.
The real test happens at resistance.
In today's chart, buyers had their chance at **4,512–4,515**.
They failed to break the level.
They failed to create a new Higher High.
That failure allowed sellers to regain control.
Momentum alone is not confirmation.
Execution Note (Sentinel Core)
• Watch support around **4,472–4,475**.
• Watch major resistance around **4,512–4,515**.
• Wait for both a Higher Low and a Higher High.
• Structure first → Confirmation second → Execution last.
🛡️ No confirmation = No trade.
Trend Summary
🟡 Structure: Improving
💰 Current Price: 4,476
📈 Major Resistance: 4,512–4,515
🛡️ Support: 4,472–4,475
⚠️ Status: Buyers Rejected At Resistance
Sentinel Principle
You do not trade the move.
You trade confirmed structure.
🛡️ Patience > Excitement
Series Note
Building consistency through observation, not prediction.
#XAUUSD #Gold #PriceAction #MarketStructure #SentinelCore #SentinelCompanion #Intraday #Scalping #TradingView
Amazon.com May Be OversoldAmazon.com has struggled since early May, and some traders may see opportunity in the pullback.
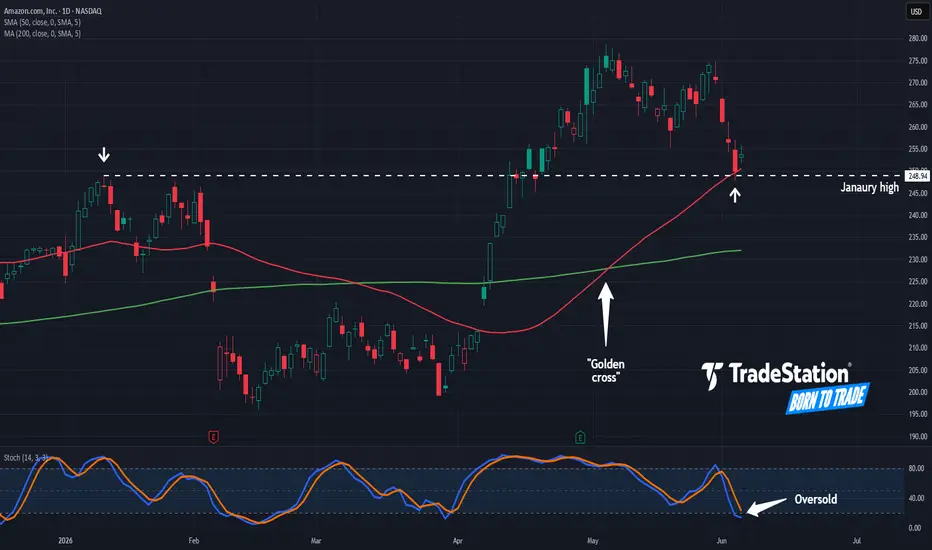
The first pattern on today’s chart is the January high of $248.94. AMZN probed that level yesterday and bounced, which could suggest that old resistance has become new support.
Second, prices are also holding the rising 50-day simple moving average (SMA). That may reflect intermediate-term bullishness.
Third, the 50-day SMA had a “golden cross” above the 200-day SMA last month. Is the longer-term trend getting more bullish?
Next, stochastics have dipped into oversold territory.
Finally, AMZN is an active underlier in the options market. (Its average daily volume of 621,500 contracts ranks eighth in the S&P 500, according to TradeStation data.) That could help traders take positions with calls and puts.
TradeStation has, for decades, advanced the trading industry, providing access to stocks, options and futures. If you're born to trade, we could be for you. Learn more here about TradingView’s Broker of the Year!
Past performance, whether actual or indicated by historical tests of strategies, is no guarantee of future performance or success. There is a possibility that you may sustain a loss equal to or greater than your entire investment regardless of which asset class you trade (equities, options or futures); therefore, you should not invest or risk money that you cannot afford to lose. Online trading is not suitable for all investors. View the document titled Characteristics and Risks of Standardized Options at www.TradeStation.com . Before trading any asset class, customers must read the relevant risk disclosure statements on www.TradeStation.com . System access and trade placement and execution may be delayed or fail due to market volatility and volume, quote delays, system and software errors, Internet traffic, outages and other factors.
Securities and futures trading is offered to self-directed customers by TradeStation Securities, Inc., a broker-dealer registered with the Securities and Exchange Commission and a futures commission merchant licensed with the Commodity Futures Trading Commission). TradeStation Securities is a member of the Financial Industry Regulatory Authority, the National Futures Association, and a number of exchanges.
Options trading is not suitable for all investors. Your TradeStation Securities’ account application to trade options will be considered and approved or disapproved based on all relevant factors, including your trading experience. See www.TradeStation.com . Visit www.TradeStation.com for full details on the costs and fees associated with options.
Margin trading involves risks, and it is important that you fully understand those risks before trading on margin. The Margin Disclosure Statement outlines many of those risks, including that you can lose more funds than you deposit in your margin account; your brokerage firm can force the sale of securities in your account; your brokerage firm can sell your securities without contacting you; and you are not entitled to an extension of time on a margin call. Review the Margin Disclosure Statement at www.TradeStation.com .
TradeStation Securities, Inc. and TradeStation Technologies, Inc. are each wholly owned subsidiaries of TradeStation Group, Inc., both operating, and providing products and services, under the TradeStation brand and trademark. When applying for, or purchasing, accounts, subscriptions, products and services, it is important that you know which company you will be dealing with. Visit www.TradeStation.com for further important information explaining what this means.  Long
Long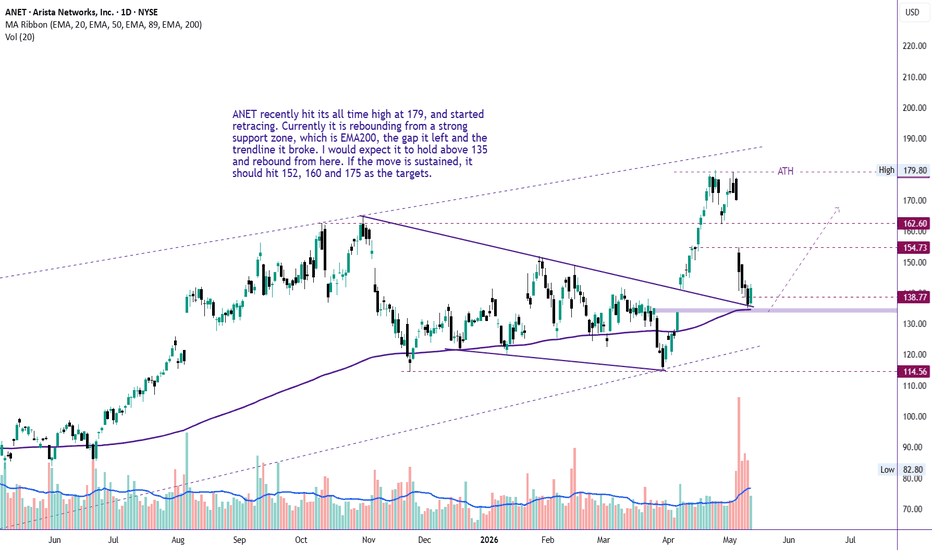
 Long
Long
 Long
Long
 Long
Long
 Long
Long
 Long
Long
 Long
Long