Inside the Algo Script Bleeding Retail Tech TradersThe Premarket 4% Pump: Inside the Algo Script Bleeding Retail Tech Traders
If you have been trading the AI hardware and semiconductor sector over the last few days, you have likely found yourself caught in a highly repetitive, brutal intraday cycle. The market opens with an explosive green surge, only to completely reverse and leave traders trapped in deep losses by the afternoon.
This isn't random market volatility. It is a highly calculated institutional distribution script designed to milk retail capital.
As historic, multi-trillion-dollar initial public offerings from the likes of SpaceX and Anthropic prepare to debut on the public markets, institutional algorithms are treating existing AI tech favorites like a corporate ATM. They are intentionally engineering a massive, daily capital transfer to build up their cash reserves.
Here is the exact step-by-step mathematical breakdown of how the algorithms play this game, why hyper-extended plays like Wolfspeed (WOLF) & SanDisk (WDC / SNDK) are the primary targets, and how you must change your rules to survive.
------------------------------
The Anatomy of the Intraday Liquidity Trap
To beat the algorithms, you have to understand the precise chronological timeline they use to lure in and extract retail capital.
Premarket Pump ──────► Opening Retail ──────► Institutional Dump ──────► Liquidity Flush
(+4.0%) FOMO Spike (Hour 2 Flush) (-6.0%)
(+7.0%) (+7.0% to -2.0%)
Step 1: The Premarket Ghost Pump (+4%)
Between 4:00 AM and 8:00 AM, US Eastern Time, trading volume is incredibly thin. Because there are very few shares moving, it takes minimal capital to manipulate a stock's price. Algorithms buy up relatively small blocks of shares, effortlessly driving an AI high-flyer up +4% before the opening bell. This lands the ticker directly onto the "Top Gainers" list of every retail broker app, creating an artificial sense of breakout urgency.
Step 2: The Opening FOMO Spike (+4% to +7%)
The opening bell rings at 9:30 AM. Retail traders, terrified of missing the next leg of the AI rally, rush in. They place market orders at the open, buying in at that inflated +4% mark. This sudden wave of uncoordinated retail buying power pushes the stock up another 3%, driving it to a brief intraday peak of +7%.
Step 3: The Hour 2 Institutional Dump (+7% to -2%)
Around 10:30 AM, the initial opening retail momentum begins to stall. This is the exact moment the algorithmic distribution script activates. The algorithms begin unloading millions of shares directly into the deep pocket of retail buy orders. Because institutional sell volume completely overwhelms market demand, the stock hits a wall. By Hour 2 (11:30 AM), all morning gains are entirely erased, and the stock slips into negative territory at -2%.
Step 4: The End-of-Day Liquidity Flush (-2% to -6%)
As the afternoon progresses, retail traders who bought the morning peak realize they are trapped. Panic sets in. They hit the sell button to cut their losses, joining the algorithms in a synchronized downward spiral. With no institutional buyers stepping in to support the price, the stock bleeds out into the closing bell, finishing the session down -6%.
------------------------------
The Mathematical Reality of the Damage
For a retail trader who chased the morning breakout, the mathematical reality of this intraday shift is devastating:
Peak Buying Price: +7%. Closing Price: -6% =-12.15% Net Drawdown in 6.5 Hours.
The algorithms successfully execute a massive capital transfer: they sell their shares to retail at a +7% premium and buy them back at a -6% discount at the end of the day, locking in a massive cash spread ahead of the June 12th SpaceX public debut.
------------------------------
The Wolfspeed (WOLF) and SanDisk (SNDK) Parabolic Warning
This trap is closing fastest on the market's most hyper-extended assets. Wolfspeed and SanDisk have been absolute monsters, rocketing up nearly 600% YTD due to the insatiable demand for AI stocks. This massive run has driven them to an extreme parabolic peak.
Over the last few days, WOLF and SNDK/WDC have swung wildly—spiking over 10% in a single morning session only to crash straight back down as institutional block trades and insider sales distribute shares to retail at the highs. Do not buy the morning gap-ups here. The algorithms are actively using this hyper-inflated valuation as a primary funding vehicle. If you hold them from lower entries, protect your capital with a tight trailing stop-loss, because parabolic trends almost always end in a swift, vertical correction.
------------------------------
The New Rules of Engagement
When the algorithms are systematically crushing the morning pump, you must completely adapt how you trade the technology sector:
Rule #1: Absolute Ban on Hour 1 & 2 Buying
Never buy a morning gap-up. If the market opens green and retail starts chasing, look away. The algorithms are waiting for that exact pocket of retail liquidity to dump their positions, typically completing the distribution script by 10:30 AM.
Rule #2: Cash is an Active, Strategic Position
Holding cash is not sitting on the sidelines; it is a high-conviction defensive move, eliminating drawdown risk, to maintain a fully loaded war chest.
Rule #3: Wait Out the IPO Transition
Until these historic mega-IPOs physically debut and the broader institutional liquidity rebalancing settles down, the technology sector will remain an unpredictable chop-house. Let the algorithms finish stripping the market to fund their new private-to-public investments.
------------------------------
Are you seeing this exact +4% to -6% algo script playing out on your watchlist today? Are you sitting entirely in cash, or are you actively shorting the Hour 2 opening reversals? Let me know your strategy in the comments below!
 Long
Long
EURUSD (H4) | Short Setup from Supply Zone | R:R 1:4.1## Reality
EURUSD remains in a short-term bearish structure following a decisive break of market structure. Price is currently retracing into a premium pricing area where supply and buy-side liquidity converge.
The broader objective is to fade strength rather than chase weakness.
## Data
* Entry: 1.1590 – 1.1600
* Stop Loss: Above 1.1618
* Target: 1.1425
* Risk: ~30 pips
* Reward: ~123 pips
* Risk-Reward Ratio: 1:4.1
## Historical Data
Recent sessions show:
* Formation of a lower high.
* Bearish break of structure.
* Strong displacement lower.
* Corrective retracement into previous supply.
Historically, rallies into supply following bearish structure shifts often attract renewed selling pressure.
## Context
The market is currently retracing within an established bearish sequence.
The current move higher appears corrective rather than indicative of trend reversal.
Price is trading within premium territory relative to the recent dealing range.
## Liquidity
A significant pool of buy-side liquidity remains positioned above recent equal highs.
This liquidity may attract price into the supply zone before sellers regain control.
Below current price, substantial sell-side liquidity remains untouched near the June lows.
## Flow
Recent flow suggests:
* Distribution near highs.
* Failure to sustain bullish momentum.
* Aggressive selling after liquidity was cleared.
* Weak buyer follow-through during retracement.
Current capital flow favors downside continuation.
## Positioning
Recent bullish participation appears vulnerable after the structure break.
This creates conditions for:
* Long liquidation.
* Reduced buyer conviction.
* Re-entry of sellers at premium prices.
## Sentiment
### Short-Term Sentiment
Bearish
### Intermediate Sentiment
Neutral to Bearish
### Long-Term Sentiment
Neutral
The market currently favors selling rallies rather than buying dips.
## Regime
Current regime remains:
* Corrective rally within a bearish structure.
* Mean reversion toward supply.
* Potential continuation lower.
## Volatility
Volatility remains controlled despite the recent expansion lower.
Benefits:
* Defined invalidation.
* Efficient risk placement.
* Attractive payoff profile.
## Correlation
Trade outcome may be influenced by:
* U.S. Dollar strength.
* Treasury yield movements.
* ECB vs Federal Reserve expectations.
* Broad risk sentiment.
Dollar strength would strengthen the bearish thesis.
## Market Structure
### Short-Term Structure
* Lower High
* Bearish Break of Structure
* Corrective Retracement
* Supply Zone Resistance
Structure remains favorable for downside continuation.
## Trend
### Primary Trend
Neutral
### Intermediate Trend
Bearish
### Immediate Trend
Bearish Retracement
The trade seeks to capitalize on the next leg lower.
## Theme
The dominant theme is:
**Distribution Following Structural Breakdown**
Markets frequently revisit supply before resuming the prevailing directional move.
## Catalyst
Potential downside catalysts:
* Rejection from supply zone.
* Stronger U.S. Dollar.
* Risk-off sentiment.
* Failure to reclaim previous highs.
## Story
After breaking structure to the downside, EURUSD entered a corrective rally. Price is now approaching a zone where trapped buyers, overhead liquidity, and institutional supply intersect.
The expectation is that the market revisits this area, attracts liquidity, and then resumes the broader bearish auction.
## Narrative
The current market narrative is:
*"Corrective strength into overhead supply before continuation toward lower liquidity targets."*
## Reflexivity
If nearby lows begin to break:
* Longs may exit positions.
* Momentum sellers may enter.
* Downside liquidity becomes increasingly attractive.
This can accelerate the move toward lower targets.
## Analysis
### Bearish Confluences
✓ Supply Zone
✓ Buy-Side Liquidity Above Highs
✓ Bearish Break of Structure
✓ Lower High Framework
✓ Premium Pricing
✓ Favorable Risk-Reward
## Thesis
A retracement into the supply zone should provide sellers an opportunity to re-enter, driving price toward the major sell-side liquidity pool near 1.1425.
## Conviction
### Conviction Level: 8/10
Reasons:
* Clear bearish structure.
* Defined supply zone.
* Strong risk asymmetry.
* Liquidity alignment.
* Clear invalidation point.
## Scenario Analysis
### Base Case (55%)
Price rejects supply and trades toward 1.1425.
### Bull Case (20%)
Price breaks and accepts above the lower high, invalidating the setup.
### Range Case (25%)
Price consolidates between 1.1550 and 1.1600 before resolving.
## Forecast
Probability favors a liquidity sweep into supply followed by continuation toward lower liquidity objectives.
## Prediction
As long as price remains below the previous lower high, rallies are likely to be sold and EURUSD remains vulnerable to downside continuation.
## Edge
The edge comes from:
1. Selling premium pricing.
2. Trading with recent structure.
3. Clear invalidation.
4. Attractive risk asymmetry.
5. Liquidity alignment.
## Asymmetry
Risk: ~30 pips
Reward: ~123 pips
Risk-Reward: **1:4.1**
The trade offers favorable downside asymmetry.
## Risk Management
Risk no more than 1-2% of trading capital.
Do not widen stops if invalidated.
Capital preservation remains the primary objective.
## Execution
### Entry
1.1590 – 1.1600
### Stop Loss
Above 1.1618
### Target
1.1425
## Positioning / Portfolio Construction
This is a tactical short position.
Recommended exposure:
* Conservative: 0.5-1%
* Moderate: 1-2%
* Aggressive: 2-3%
Avoid excessive leverage ahead of major economic releases.
## Feedback Loop
Monitor:
* Dollar Index (DXY)
* Treasury yields
* Price reaction within supply
* Volume and momentum during rejection
* Acceptance or rejection above EQH
## Invalidation
The thesis is invalid if:
❌ Price accepts above the previous lower high
❌ Supply zone fails to attract sellers
❌ Bullish structure develops on H4
## Adaptation
If invalidated:
* Exit immediately.
* Do not average into losing positions.
* Reassess after a new structure forms.
# TradingView Summary
**EURUSD (H4) – Short from Supply Zone**
🔴 Entry: 1.1590 – 1.1600
🔴 Stop Loss: Above 1.1618
🟢 Target: 1.1425
⚖️ Risk-Reward: 1:4.1
**Thesis:** EURUSD has broken structure to the downside and is currently retracing into a premium supply zone beneath a major buy-side liquidity pool. The setup seeks to capitalize on a corrective rally before downside continuation toward the larger sell-side liquidity objective near 1.1425. The trade offers defined risk, clear invalidation, and favorable asymmetry.
 Long
Long
XAU/USD 10 June 2026 Intraday AnalysisH4 Analysis:
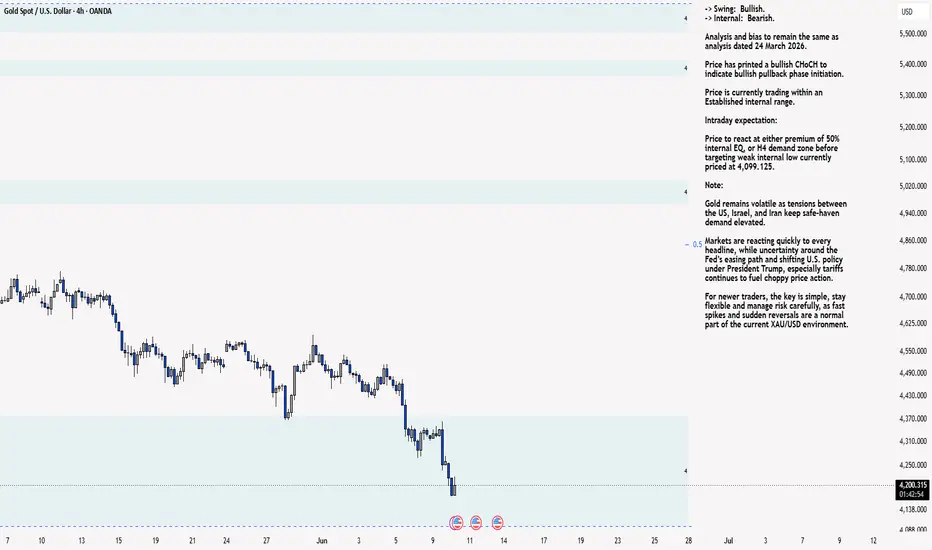
-> Swing: Bullish.
-> Internal: Bearish.
Analysis and bias to remain the same as analysis dated 24 March 2026.
Price has printed a bullish CHoCH to indicate bullish pullback phase initiation.
Price is currently trading within an Established internal range.
Intraday expectation:
Price to react at either premium of 50% internal EQ, or H4 demand zone before targeting weak internal low currently priced at 4,099.125.
Note:
Gold remains volatile as tensions between the US, Israel, and Iran keep safe‑haven demand elevated.
Markets are reacting quickly to every headline, while uncertainty around the Fed’s easing path and shifting U.S. policy under President Trump, especially tariffs continues to fuel choppy price action.
For newer traders, the key is simple, stay flexible and manage risk carefully, as fast spikes and sudden reversals are a normal part of the current XAU/USD environment.
H4 Chart:
M15 Analysis:
-> Swing: Bearish.
-> Internal: Bullish.
Price has printed according to analysis dated 08 June 2026 where I mentioned price to trade up to either premium of internal 50% EQ, or M15 demand zone before targeting weak internal low, priced at 4,268.480.
Price did not trade up to premium of 50% internal EQ, however, due to time spent, I will classify the bearish iBOS.
Price subsequently printed a bullish CHoCH to indicate, but not confirm bullish pullback phase initiation, however, I will continue to monitor price with respect to depth of pullback.
Price is currently trading within an established range and is currently trading in a H4 supply zone.
Intraday expectation:
Price to trade up to either premium of internal 50% EQ, or M15 demand zone before targeting weak internal low, priced at 4,172.565.
Note:
Gold remains highly reactive on the M15 as geopolitical risk continues to drive quick, headline‑led moves.
The tension between the US, Israel, and Iran is keeping safe‑haven demand elevated, with markets still sensitive to any sign of escalation.
At the same time, shifting US tariff policy under President Trump is adding extra uncertainty, fuelling sharp intraday swings and increasing the likelihood of sudden sentiment flips. Liquidity pockets and whipsaws remain common, making disciplined risk management essential.
Gold’s geopolitical premium is still firmly in place, and until tensions ease, short‑term volatility is likely to stay front‑loaded.
M15 Chart:  Long
Long
 Long
Long
 Short
Short
 Long
Long
 Long
Long
XAU/USD 09 June 2026 Intraday AnalysisH4 Analysis:
-> Swing: Bullish.
-> Internal: Bearish.
Analysis and bias to remain the same as analysis dated 24 March 2026.
Price has printed a bullish CHoCH to indicate bullish pullback phase initiation.
Price is currently trading within an Established internal range.
Intraday expectation:
Price to react at either premium of 50% internal EQ, or H4 demand zone before targeting weak internal low currently priced at 4,099.125.
Note:
Gold remains volatile as tensions between the US, Israel, and Iran keep safe‑haven demand elevated.
Markets are reacting quickly to every headline, while uncertainty around the Fed’s easing path and shifting U.S. policy under President Trump, especially tariffs continues to fuel choppy price action.
For newer traders, the key is simple, stay flexible and manage risk carefully, as fast spikes and sudden reversals are a normal part of the current XAU/USD environment.
H4 Chart:
M15 Analysis:
-> Swing: Bearish.
-> Internal: Bullish.
Price has printed a bullish CHoCH as per my intraday analysis yesterday dated 09/06/2026.
Price is now trading within an established range, however, I will be monitoring price with respect to depth of pullback.
Intraday expectation:
Price to trade up to either premium of internal 50% EQ, or M15 demand zone before targeting weak internal low, priced at 4,268.480.
Note:
Gold remains highly reactive on the M15 as geopolitical risk continues to drive quick, headline‑led moves.
The tension between the US, Israel, and Iran is keeping safe‑haven demand elevated, with markets still sensitive to any sign of escalation.
At the same time, shifting US tariff policy under President Trump is adding extra uncertainty, fuelling sharp intraday swings and increasing the likelihood of sudden sentiment flips. Liquidity pockets and whipsaws remain common, making disciplined risk management essential.
Gold’s geopolitical premium is still firmly in place, and until tensions ease, short‑term volatility is likely to stay front‑loaded.
M15 Chart:

 Long
Long