Bitcoin Reclaims Higher Range — What's Next?Hello traders!
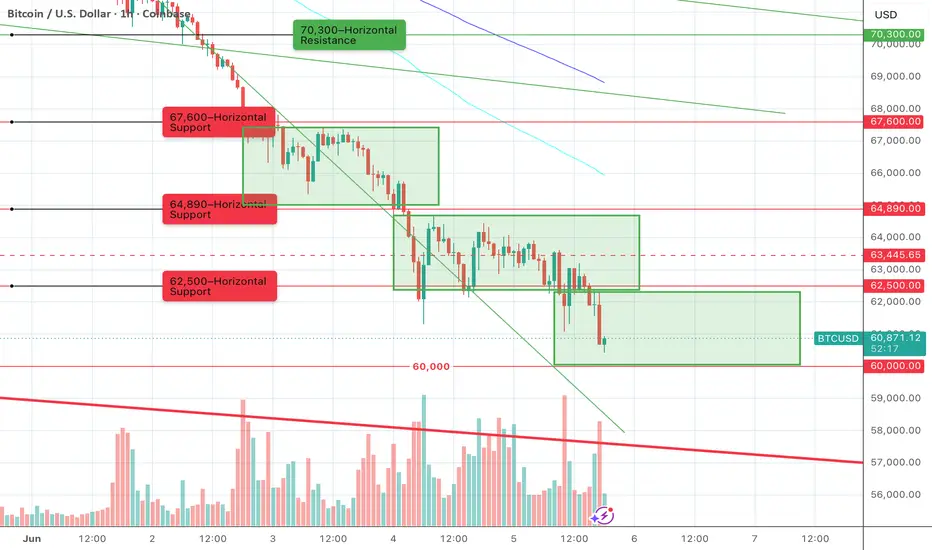
In my previous post, I warned that after the consecutive breakdown of nearly all major support levels: “the next attempt at a bounce and consolidation would likely come from the 60,000 level.”
That is exactly how the market played out. We saw a strong reaction from 60,000, followed by a quick recovery not only back into the 60,000–62,500 range, but even one step higher — into the 62,500–64,890 range.
❗️📈It is now very important to watch how price behaves as it approaches 64,890. The reaction at this level should give us a good indication of the short-term direction.
• If we break above this level, the next target could be 67,600.
• If price gets rejected, we could fall back to 62,500 and potentially even revisit 60,000.
On the positive side, we have finally stopped forming lower highs and lower lows, which gives the bulls some room to breathe. On the negative side, there is a very clear bearish divergence on the 1-hour chart, which may require a cooldown before any further upside.
Peace everyone 🌄 MESM June 8: Bounce watch 7473, then 7533MESM analysis for Monday, June 8
MESM is trying to bounce after last week’s sell-off, and for me today is more of a station-by-station session than a day to be aggressively bullish or bearish.
On the 4H chart, I’m watching 7473 as the first bounce target. If bulls can keep pushing after that, then the next upside level for me is 7533.
On the downside, I’m still watching the overnight low / liquidity around 7355.
On the 1H chart, the structure remains similar, and 7386 is the key support level for me. If we get a 1H close below 7386, then I think price could continue lower toward 7355.
On the 15M chart, the same higher-time-frame levels are still in play, with 7473 and 7533 as the upside stations.
Key levels
7473 = first bounce target
7533 = second upside target
7386 = key support
7355 = downside liquidity
Plan for today
Stay patient and trade it station by station
Watch 7473 first on the bounce
If bulls stay strong, watch 7533 next
If price loses 7386, watch for downside toward 7355
Not financial advice. No confirmation, no trade. CME_MINI:MESM2026  Long
Long
BTC Keeps Repeating the Same Bearish PatternHello, traders!🧨
We continue to watch the crash unfold in real time⚰️
The decline is developing in waves, following almost the exact same pattern each time: a key horizontal support breaks, price attempts to move into a sideways range, fails, and then another leg down follows.
❗️First, the 67,600 level was lost. After that, price attempted to establish a range between 64,890 and 67,600. The attempt failed, and the market moved lower.
❗️Over the past 24 hours, the same scenario repeated once again. The 64,890 level was broken, followed by an attempt to form a range between 62,500 and 64,890. That attempt also failed, leading to another wave of selling.
✅✅✅The next potential bounce and attempt to move into a sideways range could occur around the 60,000 level.
For now, the market structure remains unchanged — every local range ends with a downside breakout and a continuation of the downtrend.
Peace🌄  Short
Short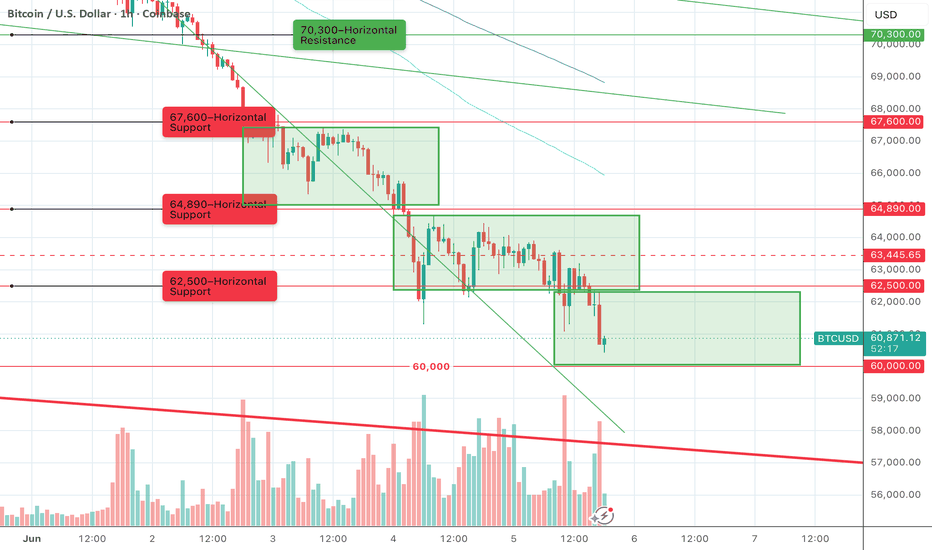
GOOGL - Do you want to know how I got these levels?Good Evening Ladies and Gentlemen,
You know what I've noticed? Nobody panics when price stays inside the box. Even if the chop is horrifying. If tomorrow I tell the street that a retail trader blew up their account trying to catch a falling knife, nobody panics, because it's all "part of the plan." But when I say one little orange floor at 365.89 is going to break... well, then everyone loses their minds!
Google is currently playing in the dirt at 361.84, having sliced right through that itty bitty support node at 363.15. The bulls set up their little rally, thinking they'd be safe at the bottom of the orange box. But the market just proved it doesn't care about their order blocks.
Right now, the bulls are looking up at 365.89, hoping they'll get let back inside. But price is officially trading outside of value, and gravity is taking over.
It's simple. We trade the reactions at the edge:
Above 365.89: If they somehow crawl back into the box and accept it, fine. The schemers get their little rotation back up toward 379.04. The established order resumes. Boring. Alternatively, a clean LBAF (Look Below And Fail) at the previous day low of 358.43 gives us the perfect trap to punish early shorts and ride it back up into the box.
Rejection at 363.15 or 365.89: This is where the fun begins. Trading higher first, or a bounce that gets smacked back down here, means I favor downside continuation—especially if trading higher first. And if they give us a LAAF (Look Above And Fail) at the previous day high? That’s the PERFECT setup to introduce a little anarchy, targeting the previous day low at 358.43.
Below 358.43: If they slice through yesterday's low like it isn't even there (no LBAF games), GOOGL will take a walk down Crime Alley to get mugged in the dark at the 353.22 volume node. And if that level doesn't save the day, then the trapdoor opens to 347.82.
Madness...entropy, whatever you wanna call it...is like gravity. All it takes is a little push. And right now, GOOGL is teetering on the edge. It needs to prove whether it's reclaiming the box, or if we're putting a frown on Sundar's face.
Remember friends...
This is not financial advice, I'm just a guy with an interest and a Celsius addiction... and tonight I'm a man of my word.
~The Villain  Long
Long
 Long
Long
 Long
Long
 Long
Long
Great Google MoogleyGOOGL is sitting in one of those spots where the chart is doing a very simple thing in a very annoying way: rotating inside a box and making everyone work for the answer.
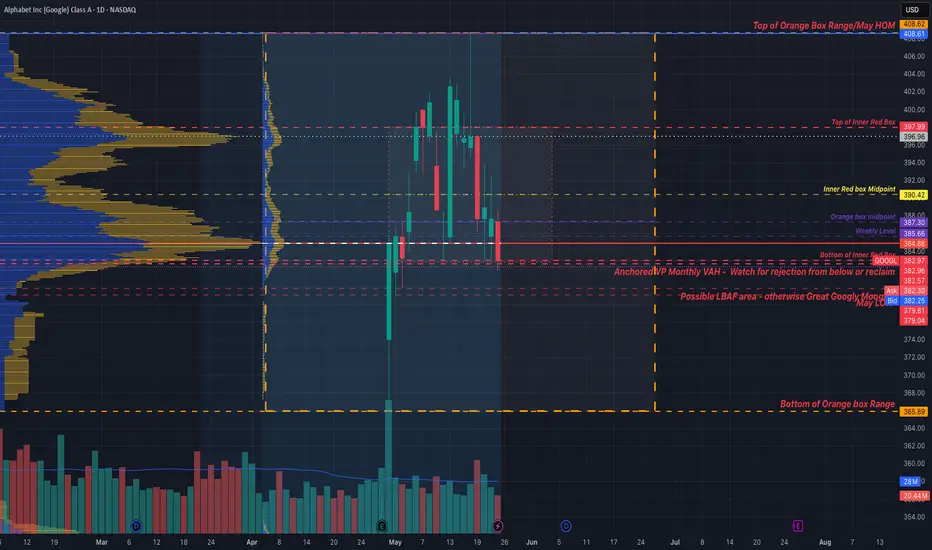
The bigger picture is the orange box, with the bottom of range at 365.89 and the top of range / May high at 408.61. That is the real battlefield. Inside that, we’ve got the inner red box, with 384.88 at the bottom, 390.42 as the midpoint, and 397.99 at the top. For now, this still looks like a classic box-to-box trade until price proves it wants to expand out of range.
The level that matters most to me right here is the anchored monthly VAH / reaction zone around 382.57-382.97. That is the line in the sand. It sits just under the bottom of the inner red box, and it’s the level that can decide whether this thing rotates back into value or breaks down and starts targeting lower prices.
Bullish case:
Bulls want to hold or reclaim the 382.57-382.97 monthly zone and turn it into support. If they can do that, then I’m looking for rotation back into the box at 384.88, then the weekly level at 385.66, then the orange box midpoint at 387.30, and after that the inner red box midpoint at 390.42. If buyers can actually start accepting above 390.42, then the next magnet becomes 397.99.
This is where a day trade can become a swing on the long side. If price gets above 390.42 and starts building acceptance instead of just tagging it and fading, then the trade stops being just an intraday box rotation and starts looking like a swing setup toward 397.99. If bulls can ultimately accept above 397.99, then the larger swing target opens toward 408.61.
Possible LBAF trade:
If GOOGL flushes below the 382.57-382.97 monthly zone or even probes into 379.81-379.04, but cannot find acceptance lower and quickly reclaims the level, that becomes a Look Below and Fail setup. That would favor a long back into value, with upside rotation targets at 384.88, 385.66, 387.30, and possibly 390.42 if momentum builds.
Bearish case:
Bears want price to keep failing at the 382.57-382.97 monthly reaction zone or reject from the 384.88-385.66 area and roll back over. If that happens, then I’m watching for a move into the May low / lower support area around 379.81-379.04. If that shelf gives way, then the downside opens into the lower half of the broader orange box, with 365.89 as the major destination.
This is where a day trade can become a swing on the short side. If price loses 379.04 and cannot reclaim it, that stops looking like a local flush and starts looking like a higher-timeframe breakdown. At that point, the short can start carrying as a swing toward 365.89. Is the Dollar Index About to Break Out? (I Was Lied To!)The Dollar Index is sitting at a very interesting level right now, repeatedly testing a major resistance zone without pulling back in any meaningful way. While many traders believe multiple tests strengthen a level, I actually lean toward the opposite view.
In my experience, the longer price hangs around a structure level without getting pushed away aggressively, the more likely that level is to eventually break.
That’s exactly what we’re seeing on DXY right now. Buyers have been rejected several times, but sellers still haven’t been able to take control. Instead, price continues to consolidate just beneath resistance, creating the potential for a bullish breakout.
On the lower time frame, we’re even seeing signs of higher lows forming, which adds to the bullish pressure building underneath the surface.
Of course, confirmation still matters. A clean break and close above resistance would provide a much stronger signal that price is ready to continue higher toward the next structure level.
For now, this is definitely a market worth keeping an eye on.
If you have any questions or comments please share them below.
Akil  Long
Long

Bitcoin Outlook for the day & setup for Pullback trade.After a sharp Correction that was started on 14th may, price seems to found a holding ground and consolidating in a sideways direction, withing a narrow range for sometime, breakout of this range might trigger a quick up move (Pullback), to capture that move we can take long position above the highest level of the range.
where as on the downside if the price continues to fall below 76000, the outlook can be very weak.
Point to notice
Current downfall stalled at the 0.786 fib level of previous upswing which was started on 29th April & It can act as a strong support.
Important levels
On the downside 76,000 is the immediate support level.
where as (on intraday time frame) on the upside, level of 77,755 crucial, it can act as an important hinderance, Strict Risk management and Position should be sized according to individuals risk apatite.
Trade I'm looking forward to
Buy: 77,366
SL: 76,419
TP: 78,800
Strict observation is required.
For Educational Purposes only, Not an Investment Advice Long 
MESM May 19: Sitting on hands until 7372 or 7454 breaksMESM analysis for Tuesday, May 19
MESM is still trading inside yesterday’s range, and right now price is sitting around 7400. Because of that, this is not the kind of session where I want to be aggressive in the middle of the structure.
On the 4H chart, the key downside level I’m watching is 7372, which is yesterday’s low. If price breaks that level, then I think we could see downside continuation.
On the upside, the key bullish confirmation level for me is 7454. If we get a 4H candle close above 7454, then I think the trend could continue higher from there.
On the 1H chart, the structure remains range-bound between the marked levels, so I’d rather stay patient than force a trade inside the middle of the range.
On the 15M chart, the upside liquidity I’m watching is 7476, while the downside target I’m watching is 7362. Once the higher-time-frame range breaks, those 15-minute targets become more relevant.
Key levels
7454 = 4H bullish breakout level
7476 = upside liquidity
7372 = yesterday’s low / downside trigger
7362 = downside target
So for today, my plan is:
Stay patient while price remains in range
If price breaks 7372, watch for downside continuation
If we get a 4H close above 7454, watch for bullish continuation toward 7476
Not financial advice. No confirmation, no trade. CME_MINI:MESM2026