MESU Aug 28: Neutral Between 7723 and 7755MESU remains inside a relatively balanced short-term structure, so my bias for today is neutral until price confirms outside the current range.
On the downside, the first liquidity level I’m watching is around 7,723.
The more important bearish confirmation level is 7,700. A confirmed 4-hour or 1-hour close below that area would weaken the current structure and shift my bias from neutral to bearish.
On the upside, 7,755 is the first liquidity level. A confirmed 15-minute close above 7,755 coul
Rectangle
FTNT Double Bottom Breakout after stage -2 UpmoveChart :
18 months of tight basing gave way to a clean breakout (+20% move off the base), followed by a sustained Stage 2 uptrend — higher highs, higher lows, price holding above rising 10/20-EMAs. After consolidating just under the prior ATH, price formed a double bottom and price is now pushing to fresh all-time highs with a +9% move over the last 6 months. Classic consolidation and breakout setup.
The Fundamentals
Q2 FY26 beat its own upper guidance — revenue $2.05B (+26% YoY), product re
Holding $80K keeps $82.5K in playHey traders! 👾✊🏼
For 8 consecutive sessions, we’ve seen significant capital inflows into U.S. spot crypto ETFs, with total inflows now reaching an impressive $3.8B 💰💰💰
As I mentioned earlier, this rally is no longer being driven solely by short covering. We’re also seeing continued institutional demand supporting the move.
So, what’s happening on the chart right now? 🧐
It’s pretty clear that the bulls have no intention of giving up control just yet. Price is currently trying to establish it
MESU Aug 26: Range Between 7655 and 7714 Before NVDAMESU remains inside a choppy higher-time-frame range, with 7,655 and 7,714 acting as the primary boundaries.
For today, my base case is continued range-bound price action rather than an immediate directional breakout.
Inside the range, short-term liquidity sits around 7,670, which could be swept before price makes its next larger move.
On the upside, 7,714 is the key decision level. A confirmed breakout and acceptance above that level could open the path toward 7,733, followed by the larger u
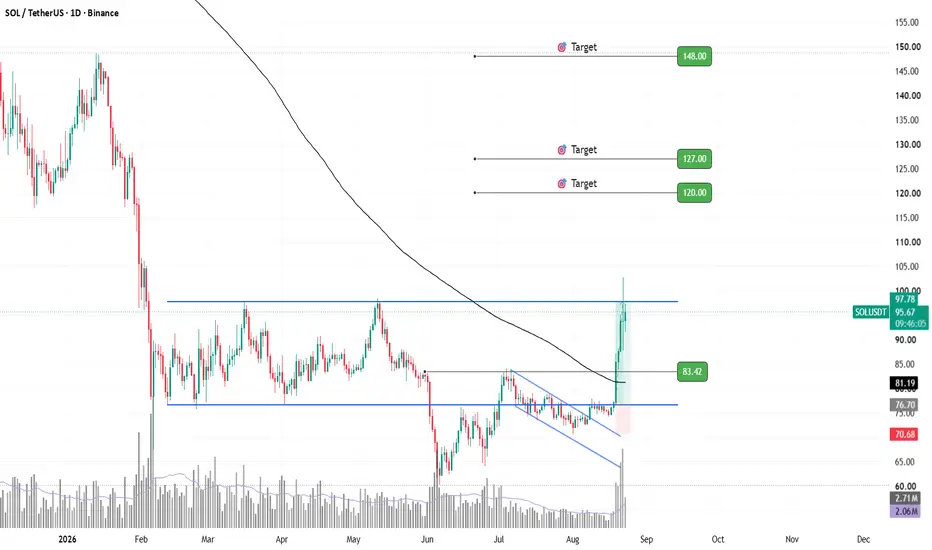
SOLUSDT | Rectangle Breakout SetupBINANCE:SOLUSDT has spent several months trading inside a broad rectangle range on the 1D timeframe.
Price has now broken out of the short-term descending channel, reclaimed the 200-day moving average, and is approaching the upper boundary of the larger rectangle.
Current price: $95.43
Key breakout zone:
$97.78 - $100.00
A confirmed daily break and hold above this area would strengthen the rectangle breakout and open the path toward the projected targets.
Targets
🎯 Target 1: $120.00 (+25.7
Ethereum price structure & important levels.Ethereum is been consolidating within sideways range of 1979 & 1800 since 15th July, the structure seems like supported by the bullish trendline. over all structure seems to be dependent on the breakout direction, if price gives breakout above the level of 1979, which is most important resistance level of the price chart then we should be looking for long entries, and if it gives breakout in the bearish direction breaching the levels of 1800 then we would be looking for continues shorting opport
Bulls Win the 65K Battle. Next Stop 78K.Hi traders! ☀️🌴🧠
At this point, the consolidation within the 60–65K range has ended with a clear shift in momentum toward the bulls 🦬🚀
In all my posts over the past few months, I’ve highlighted the importance of the 65K level, so I hope this breakout didn’t catch you off guard.
“The bullish scenario, with upside targets at 67K and 67.6K, will only come back into play if Bitcoin manages to reclaim 65K and, more importantly, hold above it.”
It was practically impossible to predict exactly wh
NZDUSD: Bullish Continuation 🇳🇿🇺🇸
NZDUSD will likely rise further after a retest of a recently broken
resistance of the range on an hourly time frame.
Target - 0.597
❤️Please, support my work with like, thank you!❤️
I am part of Trade Nation's Influencer program and receive a monthly fee for using their TradingView charts in my analysis.
Gold Bullish Breakout — 4600 in FocusGold (XAU/USD) has broken out of a multi-day consolidation range with strong bullish momentum. The range resistance has been cleared, turning the previous resistance area into a potential support zone.
With today’s FOMC minutes and major U.S. political/news flow, volatility could increase significantly. If bullish momentum continues and price holds above the breakout/FVG area, 4,600 becomes the key upside target.
Target: 4,600
Key support: 4,430–4,435 area
TP1: 4,550
TP2: 4,575
TP3: 4,600
MESU Aug 19: Bounce Toward 7760–7780 or Break 7700?MESU remains inside a broader pullback structure, but there is still room for a short-term bounce into the fair value gaps above.
The first upside area I’m watching begins around 7,742, with 7,760 as the first continuation target if buyers regain momentum. Above that, the larger fair value gap around 7,780 remains in play.
On the downside, 7,700 is my key intraday breakdown level. A confirmed 15-minute close below 7,700 could open the door toward the higher-time-frame fair value gap around 7,6
MarketBreakdown | EURNZD, GOLD, AUDCHF, USDCAD
Here are the updates & outlook for multiple instruments in my watch list.
1️⃣ #EURNZD daily time frame 🇪🇺🇳🇿
EURNZD is going to test a major daily resistance cluster.
I will look for a pullback trade from that.
2️⃣ #GOLD #XAUUSD daily time frame 🥇
The market continues a consolidation within a horizontal range.
We can expect a bullish movement from its support.
3️⃣ #AUDCHF weekly time frame 🇦🇺🇨🇭
The market reached a major historical key level.
With a high probability, the price will
USDCHF: Breakout at the range top before PPI?📊 USDCHF: Breakout at the Range Top Before PPI?
USDCHF is testing the upper boundary of its recent range near 0.8138-0.8140.
Price has already bounced strongly from the 0.8055-0.8060 support area and is now pressing into the same resistance zone that capped previous upside attempts. This makes the current level important: either buyers confirm a breakout, or the pair rejects again back into the range.
The timing matters because the next U.S. inflation catalyst is PPI on Thursday, Aug 13 at 12
EMAAR: Confluence Rejection at Midline & SMA Signals DownsideHi everyone!
Emaar Properties continues to trade within a multi-month distribution structure, with recent daily price action pointing to further downside momentum.
Confluence Rejection: Price attempted a relief rally but was decisively rejected at the confluence of the 100 SMA and the midline of the horizontal consolidation range (11.80–12.00 AED).
Failure to Hold: The inability to reclaim the midline reinforces seller control, leaving the lower boundary of the consolidation range (10.80 AE
DXY 1H: Support Liquidity Sweep & Reclaim (Long Setup)
1. Market Context
On the 1H chart, the US Dollar Index (DXY) is compressing near the key horizontal support floor at 99.157 after declining from the 99.717 resistance peak. We wait for a liquidity sweep below support before executing a long setup.
2. Trader Behavior & House Trap Analysis
Where Traders Place Orders: Seeing 99.157 hold as a multi-touch floor, retail traders are placing BUY orders around 99.157 – 99.222 (marked "Buyer"), expecting another bounce.
Trader Stop-Loss & Target: Reta
EURUSD important breakout, up move to continue?Price had been consolidating within the range of R-1(1.1580) & S-2(1.1511) from 4th Aug, today it gave breakout from R-1 which may lead price to continue it's move in the bullish direction, and it's very likely that price may retest the level of 1.1619 in the near future.
Currently we may see some pullbacks, till S-1(1.1560) before continuing in the upper direction, that could be fresh opportunity to take long entries, for the target of 1.1619 which is yet another important resistance zone.
Ov
ZW1! 1H: Descending Channel Breakout & Resistance Reclaim1. Market Context
On the 1H chart, Wheat Futures (ZW1!) broke out above the purple descending channel. Price bounced strongly off the "Buyer" base and is currently pressing against the key horizontal resistance at 656'2.
2. Trader Behavior & House Trap Analysis
• Where Traders Place Orders: Seeing the horizontal resistance ceiling at 656'2, retail traders are opening SELL orders (marked "Seller"), expecting price to reject and fall back toward 627'4.
• Trader Stop-Loss & Target: Shorters are pl
Potential Bullish continuationWe are consolidating currently, but we get a break above 215. 20 and retest, we could see price continue and test daily imbalance around 216.200, before we see more downside move ment. Imbalance is sitting in between, 618 and 786 fib, with a deep retracement like that we could be preparing for a big drop. But why not catch some pips on the way up. Japan will intervene again to prevent excessive Yen weakness
Silver : Another 12% move incoming ?Silver just made a major breakout and its next move might be even bigger.
The bullish signs were there all along for Silver; the liquidity grab from the lows , the hold of the 56.5$ area were signs that Silver was bullish.
Looking at current price , breaking above 63$ and taking a measured move from the lows and high of the previous range that silver was moving in , our next move might be towards 70$. That’s another 12% move up. You might think it’s too much , but Silver is prone for these v