VeChain: bouncing back? key levels and targets for the next daysVeChain. Wondering if this old supply-chain dinosaur still has some life left in it? While majors grab the headlines, according to industry sources VeChain keeps popping up in real-world adoption talks and green-tech narratives, and traders are quietly rotating into beaten-down L1s again. That combo plus this chart setup has my attention.
On the 4H chart VET just bounced cleanly from a chunky demand zone around 0.0066-0.0070, with RSI ripping from oversold to above 50 - classic momentum reset. VPVR shows a volume shelf just above price, so a push through 0.0073 opens the door toward the next red supply band around 0.0078-0.0084 and, if momentum sticks, even a liquidity grab closer to 0.01. I might be wrong, but this looks like the first real higher low we have seen in a while. ✅
My base plan: look for longs on dips back into the green zone, as long as price holds above 0.0066, aiming for partial takes near 0.0078 then 0.0084+. If buyers completely fumble and we close back under 0.0066 with RSI rolling over, I flip the script and expect another leg down toward fresh lows instead. For now I’m flat and waiting for either a clean retest of support or a strong 4H close above 0.0073 to confirm the breakout. HIMS (USA) - Strategic Pivot Following Big Partnership NewsHims & Hers Health has had a brutal dump over the last year and is down around 80% off its highs as it battled court-cases and regulatory headwinds. Based in San Francisco, the telehealth platform has traditionally focused on direct-to-consumer treatments for hair loss and sexual health, but the real story recently was its high-stakes entry into the weight-loss market . After a period of heavy selling following a fallout with regulators, the stock has started to show some life again, recently bouncing as the company gets some wins and also pivots its strategy.
The fundamental narrative has shifted significantly in just the last few weeks. The big news driving the recent move is a surprise peace treaty with Novo Nordisk that was announced at the end of last week.
See: www.reuters.com
After a bitter legal feud over compounded versions of obesity drugs, the two have reportedly agreed to a partnership that will see Hims sell branded versions like Wegovy and Ozempic directly on its platform. On top of that, the company just signed a massive $1.15 billion deal to acquire Eucalyptus, an Australian digital health leader. This move isn't just about growth; it’s an aggressive push to diversify away from US regulatory risk by expanding into Australia, Japan, and deeper into Europe.
Technically , the chart is starting to look like a classic "washout and recovery" play. The stock has been in a steep decline, but the price action is now testing the 20-day SMA from below, which is often the first step in a trend reversal . We’ve seen a strong surge in volume coinciding with the partnership news, and the RSI is still looking very oversold in the low 30's. While the 50-day and 100-day SMAs are still sloping downward and sitting overhead as potential resistance, the MACD histogram has turned positive for the first time in weeks. This suggests the selling momentum may have finally stalled out.
It looks very oversold, and the legal and regulatory battles that caused it to dump might be getting resolved. Even if it only recovers a small part, there is plenty of upside which means it could be worth a watch.
..................................................
PLEASE NOTE: Nothing I post is trading advice. All investing involves risk, and past performance doesn’t predict future results. Trends can and do end. For 2026 , my goal is to try and post one new asset each trading day. Something outside the usual gold, silver, BTC, or big tech names. I like to find stocks worldwide showing steady trends with some good gains, a recent pullback, and signs of renewed strength. I don’t necessarily hold positions in these. They are simply companies I find interesting at the time of posting. I’ll often revisit them within a week to see how they went and share any updates. If you enjoy these posts, please BOOST and FOLLOW ME to discover more under-the-radar stocks and businesses from around the world.
..................................................
 Short
Short
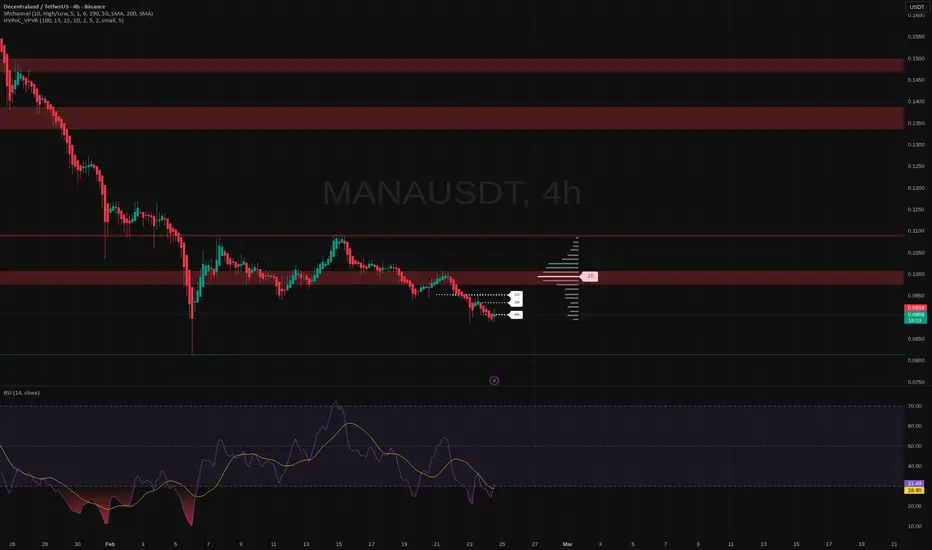
Skycoin: ready for a comeback? key levels and targets aheadSkycoin. Ready for round two on this forgotten alt, or was that pump the whole story? While majors chill after the latest BTC move, according to market sources traders are rotating into old-school small caps again, and Skycoin just had a vertical spike followed by a sharp flush. Price is still holding above the early March base, so the dump looks more like a clean-up than a full rug… so far.
On the 4H chart, price is sitting right on the first green demand zone around 0.07 after a big liquidation candle. Volume climaxed on the drop and is fading, while RSI bounced from oversold and is curling back toward the midline. That combo screams potential bounce to me, with the nearest liquidity magnets around 0.075 - 0.08.
My base plan: I like longs only while we hold this 0.07 box, hunting wicks into 0.07 - 0.068 with bullish reaction and targeting 0.075 first, then 0.08. If we get a 4H close below that lower green zone, I flip bias and look for a deeper sweep into 0.065 - 0.062 instead. I might be wrong, but I’m not buying the narrative that this move is dead just yet. ✅ Long bias above 0.07, ⚠️ trend flips if support cracks. APT: knife or bounce? key levels to watch for todayAPT. Is this where the knife finally lands on a mattress instead of the floor? Alt L1s have been lagging while majors steal the show, but according to market chatter APT’s ecosystem activity and staking flows are starting to tick up again, so this demand zone suddenly matters a lot.
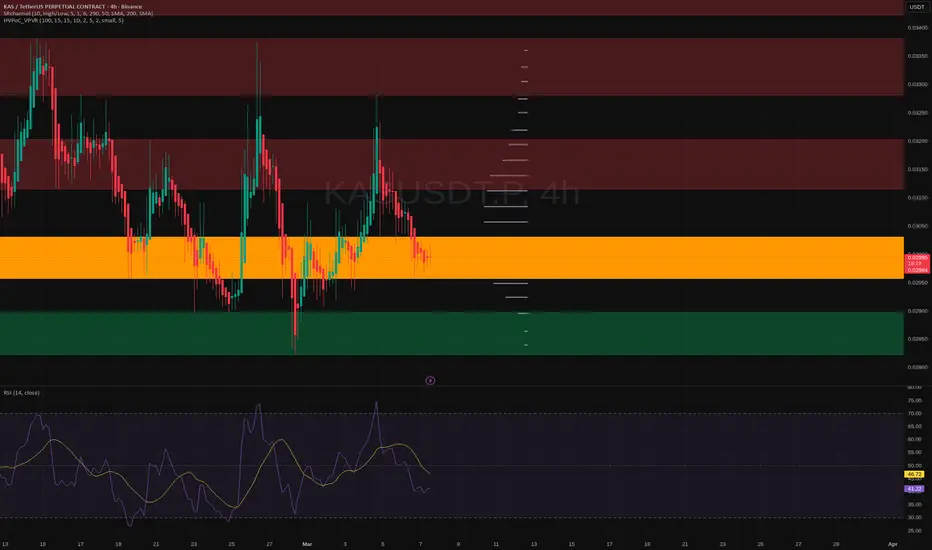
On the 4H chart price is sitting right inside that big orange high-volume area after a sharp selloff, with RSI trying to curl up from near oversold. That combo often fuels relief bounces, so I lean bullish here, looking for a move back toward the upper range and the dark-red zone above. I might be wrong, but for now this looks more like late sellers, not fresh breakdown energy. ✅
My base plan: look for a 4H close back above the mid-orange area to confirm buyers, then target roughly 0.96 first and 1.00-1.02 next. If price loses the bottom of orange and holds below it, then the door opens to that green zone lower where I’d watch for the next buy setup instead. Until one of those triggers, I stay patient and let the levels do the talking. ⚠️  Long
Long
Bittensor (TAO): ready for a rebound? key levels to watchBittensor. Who’s trying to ride the next AI leg up instead of chasing tops again? According to market chatter, AI coins are back on everyone’s radar and TAO has been holding up better than most on pullbacks, so this 4H setup has my attention right now.
On the 4H chart price is bouncing inside a chunky demand block around 175‑185 after the last selloff, while the earlier supply sits up near 205‑215. RSI is curling up from the mid‑50s, not overheated, and volume isn’t screaming panic, which usually means sellers are running out of fuel. That combo makes me lean long from this zone, looking for a squeeze back into the red supply above.
My base case ✅ a grind higher toward 205‑215 as long as bulls defend the 172‑175 area on closing basis. If we get a clean 4H close below that box, I treat it as a failed bounce and expect a slide toward the next demand around 150. I’m stalking a long on a strong bullish 4H candle out of this range – and yeah, I might be wrong, but ignoring clear levels has cost me way more over the years. HL (USA) - Has Some Upside If Silver Makes A Comeback.Hecla Mining Company has been a real standout performer lately, sitting on a 300%+ gain over the last year. As the largest silver producer in the United States, it has been a primary vehicle for traders riding the precious metals trend . It is a simple, pragmatic business that has found a lot of momentum as investors look for safety and tangible assets.
The company is coming off a strong earnings report that showed solid growth and healthy margins. This recent war pullback seems to be more about broader market nerves and sector-wide profit taking than anything wrong with the business itself. When the fundamental story is still intact, these sharp drops often just flush out shorter term the overbought hype and reset the value proposition for long-term followers.
Looking at the chart, the price has dropped back into a much better value area . It is encouraging to see that many investors were willing to pay a much higher price earlier this month, and we are now testing support near the 50-day SMA . The RSI and MACD have both reset to levels that have historically attracted buyers during this uptrend and will hopefully start to turn back up as buyers come back in.
If you think silver has a bright future, this might be worth a watch.
..................................................
PLEASE NOTE: Nothing I post is trading advice. All investing involves risk, and past performance doesn’t predict future results. Trends can and do end. For 2026 , my goal is to try and post one new asset each trading day. Something outside the usual gold, silver, BTC, or big tech names. I like to find stocks worldwide showing steady trends with some good gains, a recent pullback, and signs of renewed strength. I don’t necessarily hold positions in these. They are simply companies I find interesting at the time of posting. I’ll often revisit them within a week to see how they went and share any updates.
If you enjoy these posts, please BOOST and FOLLOW ME to discover more under-the-radar stocks and businesses from around the world.
.................................................. WLDN (USA) - Is This An Oversold Winner Belted On Future ResultsWow WLDN came in with excellent earnings again and got SMASHED not because the quarter was bad, but because its 2026 outlook disappointed .
This is a stock that I posted about earlier prior to its earnings announcement as it had some great momentum and was in a good business space. Based in California, the company provides technical and consulting services tied to energy transition and grid modernisation . It sits in an area of the market that has attracted strong interest recently, helped by rising power demand from data centres and the broader shift toward electrification. I would definitely be even more interested in this stock at these levels.
The main issue was weaker guidance . Management forecast 2026 adjusted EPS of $4.50 to $4.70, below the $4.89 achieved in 2025, which signalled possible earnings contraction. Revenue guidance of $390 million to $405 million also came in below market expectations. On top of that, a major 2025 tax benefit from Section 179D is set to expire in mid-2026, removing a boost that had lifted profits. Investors were also concerned about rising subcontractor and overhead costs putting pressure on margins.
The irony is that Q4 itself was very strong. Willdan beat earnings expectations, delivered record 2025 results, and ended the year in a net cash positive position. But the market focused on the weaker year ahead, not the strong quarter just reported.
To me this looks like a winner in a hot segment, that has been heavily oversold. Could be one to watch, but make sure it looks like it is heading back up before any entries.
..................................................
PLEASE NOTE: Nothing I post is trading advice. All investing involves risk, and past performance doesn’t predict future results. Trends can and do end. For 2026, my goal is to try and post one new asset each trading day. Something outside the usual gold, silver, BTC, or big tech names. I like to find stocks worldwide showing steady trends with some good gains, a recent pullback, and signs of renewed strength. I don’t necessarily hold positions in these. They are simply companies I find interesting at the time of posting. I’ll often revisit them within a week to see how they went and share any updates. If you enjoy these posts, please BOOST and FOLLOW ME to discover more under-the-radar stocks and businesses from around the world.
.................................................. CME Group (CME) — Trend Continuation Buy, Size with DisciplineBias: Bullish (Trend Continuation – Strength)
Setup Type: Pullback within Uptrend
Entry Zone: 320.43 – 321.77
Target: 362.46
Timeframe Context: 4H / Daily
Executive Summary
We are initiating a Buy on CME within the defined entry zone (320.43–321.77), targeting 362.46. The broader structure remains constructive, supported by healthy trend strength and accelerating medium-term momentum. However, short-term internals are extended, so this is a measured conviction trade, not an aggressive chase.
Technical Structure
Trend Strength
ADX ~36 → Established, healthy trend regime.
Price structure remains intact with higher highs / higher lows.
Momentum
4H MACD accelerating → Positive momentum expansion.
Daily RSI ~70 → Overbought territory; risk of short-term pullback or sideways digestion.
Volatility Context
Price ~2.4 ATR above EMA20 → Extended from mean.
Increased probability of near-term retracement or consolidation before continuation.
This is a continuation setup, but not early-cycle — we are entering while trend is mature but still structurally sound.
Trade Plan
Entry: 320.43 – 321.77
Primary Target: 362.46
Structure: Trend continuation toward prior expansion leg projection
Expect chop or shallow pullbacks before expansion resumes.
Risk Management
Key monitoring variables:
Sudden deterioration in order-flow
ADX rollover signaling trend decay
MACD momentum loss on 4H
Material negative news flow
If trend strength fades or momentum diverges meaningfully, de-risk early.
Given:
Elevated RSI
Distance from EMA20
Proximity to recent expansion leg
→ Position sizing should be moderate (not full risk allocation).
Narrative & Sentiment Backdrop
Order-flow: Normal / stable.
Company-level catalysts: Supportive.
Third-party coverage: Mildly constructive tone.
Macro sentiment backdrop does not conflict with the setup.
Conclusion
CME remains structurally bullish within a confirmed trend regime. While internals are extended, the setup aligns with a controlled trend continuation thesis toward 362.46.  Long
Long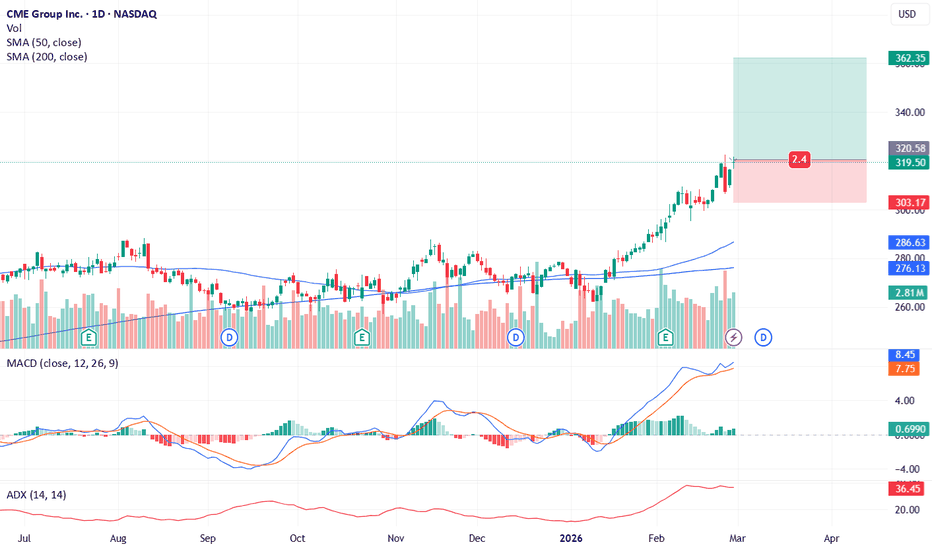
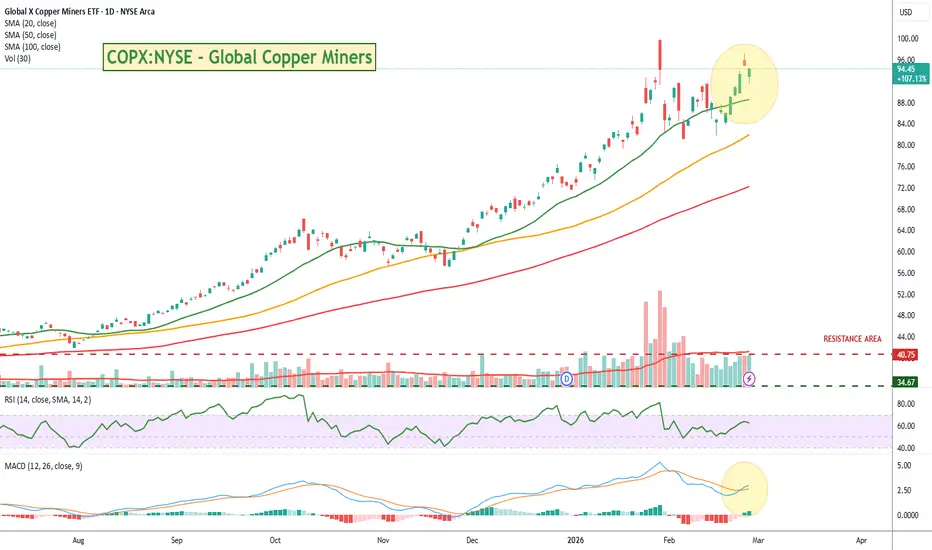
COPX:NYSE - Global Copper Miners Resuming The TrendThe Global X Copper Miners ETF has put in a good run over the last twelve months. It is up about 100 percent as the world realizes how much of this metal is actually required especially with the increased demand being driven by AI. This fund provides broad exposure to the heavy hitters in the space. It includes dominant mining giants across the Americas, Australia, and Africa.
Questions often come up about choosing this over silver equivalents. While silver has an industrial story, it often gets caught up in the emotional swings and volatility of the precious metals market. Copper is different. It serves as the industrial backbone for everything from AI data centers to massive power grid upgrades. The demand is physical and structural. This recent dip looks like a healthy pause in a strong market.
Looking at the daily chart, the technicals are lining up well. The price pulled back right into the 20 day SMA and this move into a better value area allowed the RSI to reset from overbought levels down to a more neutral area. This gives the trend some room to breathe. The MACD has just crossed its signal line and the histogram has ticked back into the green. This suggests the selling pressure is drying up.
If you like your metals, this could be one to keep an eye on.
..................................................
PLEASE NOTE: Nothing I post is trading advice. All investing involves risk, and past performance doesn’t predict future results. Trends can and do end. For 2026 , my goal is to try and post one new asset each trading day. Something outside the usual gold, silver, BTC, or big tech names. I like to find stocks worldwide showing steady trends with some good gains, a recent pullback, and signs of renewed strength. I don’t necessarily hold positions in these. They are simply companies I find interesting at the time of posting. I’ll often revisit them within a week to see how they went and share any updates. If you enjoy these posts, please BOOST and FOLLOW ME to discover more under-the-radar stocks and businesses from around the world.
.................................................. BTC Dominance: bounce or breakdown? key levels to monitorMarket Cap BTC Dominance, % - wondering if altcoins finally get a breather or if king BTC grabs even more of the pie? According to market chatter, renewed spot ETF inflows and fresh regulatory noise around some alts have pushed traders back into the safer big cap, and dominance reacted right away. That makes this support test super important for the next rotation.
On the 4H chart we’re sitting right on a fat demand box around 58.3-58.5, with HV volume showing the next big node up near 58.8-59.0. RSI just bounced from oversold, classic spot for a mean-reversion pop. So my base case is a short-term bounce in dominance toward 58.8 first, then possibly 59.1-59.3 if momentum sticks. I might be wrong, but this looks more like accumulation than a clean breakdown.
My plan: look for longs on BTC vs alts while price holds above 58.3, targeting that 58.8-59.0 zone for partials and 59.2 as a stretch 🎯. If we lose 58.3 with real volume, I flip the script - that would open the door toward 57.8 and a proper alt relief rally. For now I’m biased to a bounce, but ready to switch sides fast if this floor gives way 🚦. A: poised for a bounce? key levels to watch for todayA – ready for a little dead‑cat or full‑on trend reversal? Crypto headlines today are all about rotation into beaten‑up alts while majors cool off, and this one is sitting right on a chunky demand zone. According to market desks, liquidity in smaller caps has been quietly ticking up again – perfect time to stalk asymmetry.
On the 4H chart, price is hugging that big orange support block with several wicks rejected from below, while RSI is curling up from oversold with a mild bullish divergence. Just above, the volume profile shows a fat node around 0.08, right inside the first red supply zone – that’s the magnet for a relief move in my view. I’m leaning long, expecting a bounce rather than fresh breakdown as long as this box holds. I might be wrong, but this looks more like accumulation than panic.
My base plan: look for constructive candles and higher lows inside the orange zone, then target the 0.08–0.085 range first, with a possible extension into the upper red band if momentum really kicks in ✅. If price closes cleanly below the bottom of the box, idea flips – that opens a slide to lower liquidity pockets where I’d step aside and wait for a new base. Personally I’m interested in longs only above support, invalidated on a decisive close below it.