Bitcoin's Volatility Is MaturingOne of the most common objections to Bitcoin is volatility. It is worth understanding where volatility comes from, because it is not a fixed property of an asset.
Volatility is disagreement about value
Volatility measures how far the market is from agreeing on what an asset is worth. When an asset is new, the optimists and the skeptics hold numbers that are far apart, and price swings between them. As the asset survives and builds a track record, the disagreement narrows, and volatility falls with it.
The gold precedent
When gold became freely tradable in 1971, its price swung through a decade of wide moves while the market worked out what an unanchored gold price should be. The argument eventually settled, and gold became the low-volatility asset we treat as a benchmark today.
What the data shows
The chart above plots 26-week annualized realized volatility for Bitcoin (BNC:BLX, history from 2010) and gold (XAUUSD) in one pane. In its early years Bitcoin's realized volatility ran above 150% annualized, with a peak around 161%. Today it is about 45%. Gold's moved from about 23% to 12% over the same window. The ratio between them is 3.8x, and it has been narrowing for more than a decade.
How to build this chart
We published the indicator used here as a free, open-source script: Realized Volatility Comparator. It computes the standard deviation of log returns over a configurable window, annualizes it from the chart timeframe, and plots the same calculation for a comparison symbol. The settings behind this chart: BNC:BLX, weekly timeframe, window 26, comparison symbol OANDA:XAUUSD. A readout table shows both current values and the ratio.
How we read it
The level tells you how much disagreement remains. The slope tells you whether it is widening or narrowing. The ratio condenses the comparison into one number. We pay more attention to the slope than the level: the level says what the asset is today, the slope says what the market is turning it into.
This is educational content, not financial advice.  Education
GBPUSD – UK Data Springs into FocusGBPUSD traded at its highest level since early May on Friday at 1.3562, a gain of 2% from its most recent correction low posted on July 28th at 1.3273. While it eventually eased back down to close the week at 1.3533, it has edged higher again on this morning’s open to trade at 1.3555 at the time of writing (0730 BST).
Delving more into the details, the move higher in GBPUSD may predominantly have been assisted by a broadly weaker dollar (USD) as traders scaled back their expectations for a Federal Reserve interest rate hike in September following a key 7 day period in which US jobs data disappointed (Aug 7th), inflation (CPI) eased unexpectedly and retail sales dropped dramatically, which could be an early sign that consumers are starting to pull back on spending due to higher prices.
Looking forward, the emphasis may shift from the US to the UK with 3 important pieces of data due to be released, all of which have the potential to increase GBPUSD volatility. First up on Tuesday at 0700 BST is UK employment data, where traders may be looking to see if the unemployment rate has stabilised after hitting a multi-month high earlier in 2026. Next up is the latest CPI release on Wednesday at 0700 BST. Traders are expecting the rate to increase again after a surprise fall the previous month, so anything else could be a surprise. Then finally on Friday it’s the UK retail sales report at 0700 BST and coming on the back of a strong economic growth reading for Q2 last week, FX traders may be monitoring the details of this release to see if the positivity can continue with UK consumers maintaining their early summer spending or, like their US counterparts, they have started to cut back which could have negative implications for growth at the start of Q3.
Throw into the mix, uncertainty regarding the flow of Middle East oil supplies and the status of talks between Washington and Tehran and there is lots for GBPUSD traders to consider moving across the next 5 days.
Technical Update: Latest Recovery Back to Important Resistance:
Since the June 24th low was posted in GBPUSD at 1.3140, when political uncertainty over Keir Starmer’s resignation gripped UK market sentiment, stability within price activity appears to have returned. This saw a strong recovery materialise into the July 15th high at 1.3558 which now may have become the immediate resistance focus for the week ahead.
This argument appears to have been strengthened by the fact that last Friday’s price strength was capped by this level, prompting a setback into the close. Traders could potentially view this 1.3558 high as a key level for the coming week and how it is defended on a closing basis could indicate where the next directional themes may lie for GBPUSD.
Potential Resistance Levels:
After the sell‑off following tests of the potential resistance at 1.3558 (July monthly high) on Friday, it may appear this level could have established itself as an important focal point for the week ahead. How 1.3558 is defended on a closing basis this week could be instrumental in determining the direction of future GBPUSD price moves.
If 1.3558 were to give way on a closing basis, traders may shift their focus on to 1.3658, which is the May 1st session high, as the next resistance. If this level were also breached, upside momentum may continue toward 1.3733, the February 4th high.
Potential Support Levels:
Of course, the resistance at 1.3558 currently remains intact and while this continues, the risks are that price action could turn lower again. If this is the case, traders may be attempting to establish key support levels that, if broken, could see downside momentum emerge again.
If further downside is to be seen, it may be closing breaks below 1.3475 (last week’s low), that triggers it. Such a move could extend any declines, shifting the focus toward 1.3451 (38.2% Fibonacci retracement) and then possibly 1.3417 (50% Fibonacci retracement).
The material provided here has not been prepared accordance with legal requirements designed to promote the independence of investment research and as such is considered to be a marketing communication. Whilst it is not subject to any prohibition on dealing ahead of the dissemination of investment research, we will not seek to take any advantage before providing it to our clients.
Pepperstone doesn’t represent that the material provided here is accurate, current or complete, and therefore shouldn’t be relied upon as such. The information, whether from a third party or not, isn’t to be considered as a recommendation; or an offer to buy or sell; or the solicitation of an offer to buy or sell any security, financial product or instrument; or to participate in any particular trading strategy. It does not take into account readers’ financial situation or investment objectives. We advise any readers of this content to seek their own advice. Without the approval of Pepperstone, reproduction or redistribution of this information isn’t permitted.
 Long
Long
AVGO GEX - Negative GEX Below HVLAVGO has broken down from a multi-week sideways range on the daily chart and is now trading below HVL at 407.5 , inside a negative GEX regime .
If the decline does not slow, the next structural target is 380 – P1 . Overhead, 440 – C1 remains the highest call wall, well above this breakdown. Price has already lost the 400 Ab1 cluster.
🔶 Regime Context 🔶
Below HVL, AVGO sits in a more reactive GEX regime. A reclaim of 407.5 would be the first sign of repair — until then, the structure stays downside-oriented.
🔶 Downside Structure 🔶
👉 380 – P1 (strongest put wall)
Confluence at 380:
P1 — strongest put wall / largest negative NETGEX
nPV — strongest net put volume
If 380 fails, price enters the negative extension zone , with downside gamma squeeze potential toward 350 (P2) .
🔶 Options Sentiment 🔶
CALL$ 48.7% means call options at an equivalent distance from spot are priced 48.7% higher than the corresponding puts — this is call pricing skew . Even after the selloff, calls remain the more expensive side.
On the Options Oscillator, the green histogram remains elevated at the right edge — call skew is still persistent .
IVRank 35.2
IVx 51.7 | IVx 5dCh -1.7%
CALL$ 48.7% — call pricing skew
Implied move ±1.19% (±4.7)
🔶 Key Structure to Watch 🔶
407.5 (HVL) — regime pivot, now overhead
380 (P1) — next put wall / target
440 (C1) — highest call wall
The key question: does 380 slow the decline — or does acceptance below P1 open the extension toward 350 ? Short 
 Education
USDJPY – Squeeze Testing Resolve of Japanese AuthoritiesAfter a short but sustained period of intervention, or in the recent case of USDJPY, joint intervention by Japanese and US authorities to strengthen the Japanese Yen (JPY) against the US Dollar (USD), which created a sharp down move from multi-decade highs at 163.95 on July 28th to a low of 155.23 on August 3rd the popular currency pair is back trading at 159.35 again at the time of writing (0645 BST).
Intervention to impact a currency pair can be effective in the short term as it puts traders on notice that one-sided moves will not be tolerated. However, once the dust has settled if the macro backdrop hasn’t changed, such as the market perception of the speed of interest rate hikes from the Bank of Japan (BoJ) or the policy decisions of Japanese PM Sanae Takaichi’s government to help stimulate economic growth remain in place, the USDJPY currency pair may resume its uptrend, testing the resolve of Japanese authorities once again.
In terms of interest rate differential which drive currency moves, an anti-climatic US CPI reading yesterday has seen market expectations for a Fed hike in September ease slightly, while a stronger than expected Japanese factory gate inflation (PPI) reading this morning, has seen expectations for a BoJ hike increase. This hasn’t created much of an immediate impact on the price of USDJPY, but it could suggest that the currency pair is entering a crucial period for traders where the next directional move may be established. Against this backdrop, it can be helpful to reassess the technical outlook.
Technical Update: Limited Recovery or Positive Sentiment Shift?
Following the co‑ordinated USDJPY intervention into early August, a move that tested potential long-term support at 155.03 (May 6th low), a phase of price strength has materialised. This recovery is perhaps not too surprising given the speed and extent of the initial decline, but traders could be wondering whether this latest strength represents a fresh positive sentiment shift that could lead to a more sustained rally or is simply a limited recovery before fresh weakness reemerges.
The answer to this important question could have longer‑term implications for USDJPY, and traders could find it useful to identify potential key support and resistance levels to gauge where directional themes may develop from.
Potential Resistance Levels:
It could be argued that the immediate resistance at 158.61 (38% retracement) has already given way on a closing basis, leading to further price strength this week. The focus could now shift to higher resistance points, with closing breaks above these levels required to open the possibility of further upside moves materialising.
Looking at the chart above, the next potential resistance could stand at 159.64 (50% retracement of July 23rd high to Aug 3rd low). Traders may be focused on how this level is defended on a closing basis to gauge if the current price strength has further to carry. Closing breaks above 159.64 could lead to renewed upside toward 160.69 (62% retracement), possibly further.
Potential Support Levels:
After the latest price strength, the 50% retracement resistance at 159.64 remains intact on a closing basis, and while this continues to hold, risks may turn back to the downside again. If this is the case and a sell‑off develops, closing breaks below potential support at 157.87, a level equal to the 38.2% retracement of the latest price strength, may be required.
A closing break below 157.87 could lead to fresh downside momentum, shifting focus to the next potential support at 157.36 (50% retracement), then 156.86 (62% retracement), and possibly further to test the long‑term support zone at 155.03/155.23 (May 6th and August 3rd lows).
The material provided here has not been prepared accordance with legal requirements designed to promote the independence of investment research and as such is considered to be a marketing communication. Whilst it is not subject to any prohibition on dealing ahead of the dissemination of investment research, we will not seek to take any advantage before providing it to our clients.
Pepperstone doesn’t represent that the material provided here is accurate, current or complete, and therefore shouldn’t be relied upon as such. The information, whether from a third party or not, isn’t to be considered as a recommendation; or an offer to buy or sell; or the solicitation of an offer to buy or sell any security, financial product or instrument; or to participate in any particular trading strategy. It does not take into account readers’ financial situation or investment objectives. We advise any readers of this content to seek their own advice. Without the approval of Pepperstone, reproduction or redistribution of this information isn’t permitted.
Long 
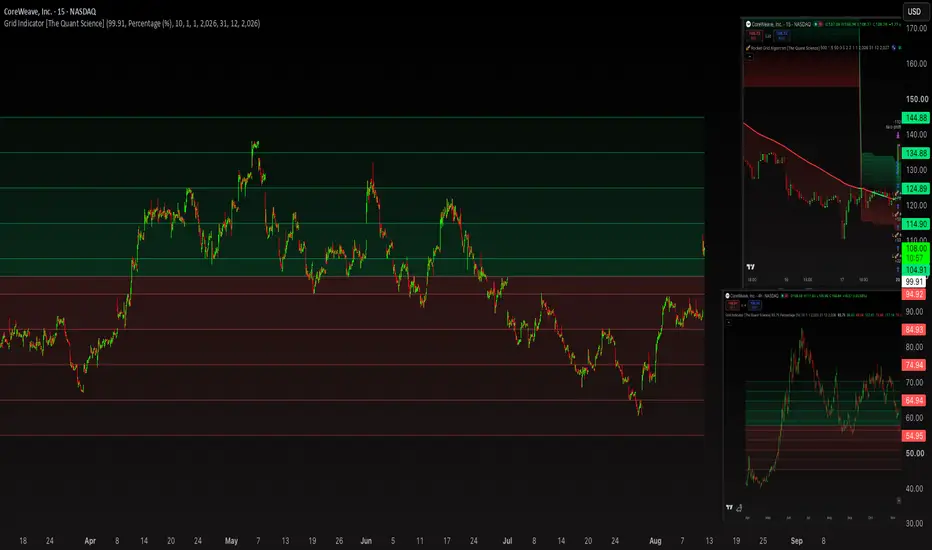
What are the ideal market conditions for a grid strategy?📰 In this article, you'll learn:
What are the ideal market conditions for a grid strategy
The metrics to look for in each market
A professional process for picking assets and set up your grid trading strategy
Short Introduction
Grid trading is a strategy based on systematically placing orders at different price levels. It literally divides the chart into a grid consisting of many horizontal levels. Grid trading is ideal for capturing volatility and profiting from price fluctuations.
Advantages and Limitations of the Grid Model
Mathematically a grid strategy performs best in stationary or "mean-reverting" markets. When the market is in a strong, directional trend, the grid strategy struggles; when the market moves sideways, the grid strategy generates consistent profits.
⚔️🛡️ As you may have guessed, the success of this strategy does not depend on the ability to predict the future, but on choosing the right battlefield.
#1 Ideal Market Conditions
For a grid strategy to be profitable and safe, the market must have three key characteristics:
Sideways Phase (Ranging): The price must move within a horizontal channel defined by clear support and resistance levels, without a clear long-term direction.
High Intraday Volatility: Within the sideways channel, the price must fluctuate constantly. The more the price moves "up and down," the more grid orders are executed (buy low, sell high).
Strong "Mean Reversion": The asset must tend to continuously correct back toward its historical average price after a price swing, avoiding one-sided breakouts.
High Liquidity: Tight spreads and no slippage are crucial, as the strategy relies on a high number of trades with small margins.
#2 Quantitative Insights: Metrics to Look For
To objectively identify the ideal market (rather than just "by eye"), you need to analyze the data using specific quantitative indicators. Whether you're setting up a screener or analyzing a chart, here are the exact values to look for:
Average Directional Index (ADX)
The ADX measures the strength of a trend, regardless of its direction.
💎 Golden rule: Look for markets with an ADX < 25 on daily (1D) or 4-hour (4H) time frames. Values below 20 indicate a market that is decidedly "dead" in terms of direction, making it perfect for the grid strategy.
Hurst Exponent (H)
This is an advanced quantitative metric used to classify price time series.
💎 Golden rule: Look for assets where H < 0.5. This value indicates a mean-reverting (anti-persistent) time series. If H > 0.5, the asset is trending and should be avoided.
To calculate the Hurst exponent, there are several excellent open-source scripts available on Trading View. For this article, we used the one created by @QuantNomad
Simple Hurst Exponent :
The available version is written in Pine 4; we’ve updating the code to the latest version, Pine 6.
You’ll find the code below.
//@version=6
indicator("Simple Hurst Exponent ", overlay = false)
length = input.int(64, title = "Hurst Exp Length")
show_smooth = input.bool(true, title = "Show Smoothed Hurst Exp?")
smooth_len = input.int(10, title = "Smoothing Length")
pnl = close / close - 1
mean_pnl = math.sum(pnl, length) / length
cum = 0.0
cum_min = 999999999.0
cum_max = -999999999.0
for i = 0 to length - 1
cum := cum + pnl - mean_pnl
cum_min := math.min(cum_min, cum)
cum_max := math.max(cum_max, cum)
dev_sum = 0.0
for i = 0 to length - 1
dev_sum := dev_sum + math.pow(pnl - mean_pnl, 2)
sd = math.sqrt(dev_sum / (length - 1))
rs = (cum_max - cum_min) / sd
hurstexp_simple = math.log(rs) / math.log(length)
hurstexp_smooth = ta.ema(hurstexp_simple, smooth_len)
plot(hurstexp_simple, color = color.new(#247352, 0), linewidth = 2, title = "HurstExp")
plot(show_smooth ? hurstexp_smooth : na, color = color.new(#ab3043, 0), linewidth = 2, title = "HurstSmooth")
plot(0.5, color = color.gray, linewidth = 1, title = "Midline (0.5)")
Average True Range (ATR)
The ATR measures absolute volatility. For grid trading, you want an ATR that’s high enough to generate profits but proportionate to the range.
💎 Golden rule: Calculate the ATR as a percentage of the asset’s price. A daily ATR of 1–3% in a market with a low ADX is the sweet spot. It will help you calibrate the distance (step) between the levels in your grid.
Bollinger Bands (BB)
Bollinger Bands measure the standard deviation around a moving average.
💎 Golden rule: Look for markets where the bands are parallel and flat (horizontal). The price should bounce consistently between the lower and upper bands without causing sharp expansions (a Bollinger Squeeze breaking out).
#3 Process for picking assets and set up
🟢 Remove all assets with low trading volume or wide bid-ask spreads. The transaction costs would erode the grid's margin.
🟢 Run a screener to identify pairs with an ADX and a strong tendency toward mean reversion over the past 3–6 months.
🟢 Visually or algorithmically identify macro support and resistance levels (e.g., the highs and lows of the past 12 months). This will define the "Upper Limit" and "Lower Limit" prices for your grid.
🟢 Use the ATR to determine the profit percentage for each grid. Run a backtest to ensure that broker commissions do not erode the profits generated by your chosen strategy.
What do you think about grid trading?  Education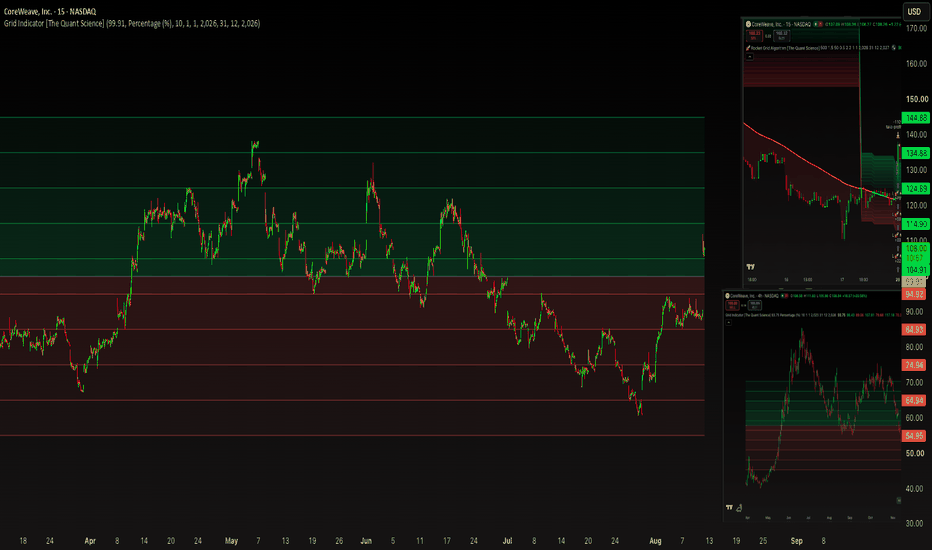
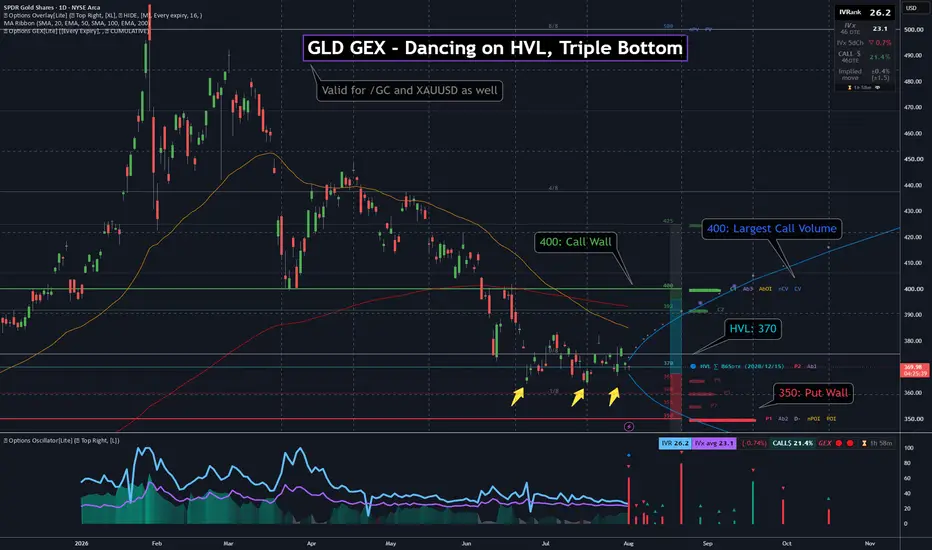
GLD GEX - Dancing on HVL, Triple BottomGLD has carved a triple bottom into the mid-360s / high-360s and is now dancing on the HVL at 370 — the gamma flip. Spot at 370.35 sits just above that pivot, so the tape is still in a positive GEX regime , but only by a hair.
That makes 370 the story: not a random round number, but where absolute gamma (Ab1), the #2 put wall (P2), and the regime line stack together. Price has defended this zone three times. The upside magnet is the 400 call wall (C1) ; the structural floor is the 350 put wall (P1) .
🔶 Regime Context 🔶
Spot is holding above HVL 370 , so the framework stays supportive — but GLD is living on the flip line, not safely extended above it. A clean loss of 370 would flip the regime read and reopen the path toward the put wall cluster below.
🔶 Options Structure Context 🔶
👉 400 – C1 (highest call NETGEX wall)
That is the primary upside reference on this 46 DTE cumulative map. The strongest call flow also landed at 400 ( CV + nCV ) — so the wall and the near-dated call volume peak rhyme.
👉 392 – C2 | 380 – C3 — intermediate call walls on the way up.
🔶 Downside Structure 🔶
👉 370 – HVL / Ab1 / P2 / D−
Confluence at 370:
HVL — gamma flip / regime pivot
Ab1 — largest absolute gamma
P2 — #2 put wall
D− — largest negative delta exposure peak
That is why the triple-bottom defense here matters: it is a multi-metric reaction zone, not just chart pattern geometry.
👉 350 – P1 / POI / nPOI
Confluence at 350:
P1 — highest put NETGEX wall
POI — highest put open interest
nPOI — net put OI peak
Together, 350 is the clear downside put-wall floor if 370 fails.
👉 360 – P3 — next put wall between HVL and P1.
🔶 Options Sentiment 🔶
CALL$ 21.4% (46 DTE) means call options at an equivalent distance from spot are priced 21.4% higher than the corresponding puts — mild call pricing skew , not an extreme bid.
🔶 Key Structure to Watch 🔶
370 — HVL / Ab1 / P2 — hold = triple-bottom thesis alive
400 — C1 call wall + CV/nCV — upside level
350 — P1 / POI — put-wall floor if HVL breaks
For now, GLD is a HVL hold + triple bottom structure inside a clean 350–400 GEX box.
The key question is whether 370 keeps absorbing dips and price can build toward 400 — or whether a break below HVL opens the slide into the 350 put wall.  Long
Long
Long 
Beware of a Significant Gold PullbackLooking at current price action, bullish momentum rapidly faded after gold broke above $4,400 during the Asian trading session, resulting in a "spike and retreat" pattern. This movement has halted the recent streak of one-way gains, signaling a transition from a trending rally phase to a period of consolidation and correction at high levels. However, the broader market outlook remains bullish; today's pullback is merely a technical correction following the recent sharp rise. Nevertheless, with the price center of gravity gradually shifting downward, a period of volatility and market "shakeout" has begun.
As the price touched a cyclical high, market sentiment and capital flows shifted significantly. On one hand, profit-taking by bulls has intensified following the sustained rally, driving demand to lock in gains at high levels. On the other, the market has entered a critical window ahead of the US July CPI inflation data release; capital is moving to reduce positions and adopt a wait-and-see approach due to risk aversion, causing the price to lose upward momentum and face downward pressure.
Combining fundamental and technical signals, the long-term trend for gold remains bullish, though the short-term outlook favors range-bound trading. Investors should avoid blindly guessing the market peak or chasing the rally. During the US trading session, focus on the support zone between $4,060 and $4,070. Entering long positions within this range is a relatively safe strategy; if the price fails to pull back to this level, remaining on the sidelines is the more prudent choice.  Long
Long
Gold - is the CPI going to push us to the support zone?Gold enters Wednesday's inflation print extended. Price has run roughly 9.5% over the past month and tagged 4435.33 intraday today, a two-month high, before slipping back under 4400 as profit taking hit a strong rally. That rejection is the level we are working from.
The economic calendar is dense. ADP employment today, July CPI Wednesday, PPI and initial jobless claims Thursday, preliminary University of Michigan inflation expectations Friday. Consensus looks for headline CPI at 3.4% year over year, down from 3.5%, with core at 2.5%. The complication is energy. WTI is up nearly 6% to 81.54 as the Hormuz reopening talks stall, so this print carries the first real pass-through, and money markets have moved to 22 basis points of Federal Reserve tightening priced by year end, up from 17 on Friday. A firm number hardens that path, lifts the dollar and real yields, and pulls the bid from a non-yielding metal that has already priced a great deal of fear.
Structurally, 4435 caps. We favour potential selling into strength beneath that ceiling with a first objective at 4317 and the 4300 demand zone as the area where buyers previously defended. Invalidation is a sustained close above 4435.
The counter-case is live. The PBoC added roughly 20 tonnes in July, its largest monthly purchase since October 2023, while Chinese gold ETFs post their longest inflow run in months. This is a fade of an extended move, not a trend trade. Size accordingly.
We have a tight stop loss due to one thing to weigh in: consensus expects CPI to cool, and a soft print would likely knock the dollar and push gold higher, not lower, so we are approaching the situation with tight risk management.
Entry - 4,385
Target - 4,317
SL - 4,421
What are your thoughts about this set-up share your mind in the comments!
As always my friends, happy trading! Short 
US 500 – Too Soon to Talk About 8000?The US 500 index faced significant challenges moving into the end of July with Washington and Tehran trading missile strikes, the Strait of Hormuz shut to oil tanker traffic, potential for incoming Fed rate hikes and investors concerned that the AI trade was ready to reverse its meteoric rise as chipmakers came under increased scrutiny.
However, despite all the negative headlines, the index held around 7300 and moving into the first week of August the sentiment backdrop started to improve, forcing traders to recalibrate positioning accordingly, especially once the US 500 broke above its previous all-time high at 7625 from June 2nd and then gathered upside momentum helped along by solid Q2 earnings, a pause to tit for tat strikes in the Middle East and a weaker than expected US jobs report on Friday, which saw markets scale back pricing for a September Fed rate hike from roughly a 65% to a 45% chance (Bloomberg).
This new trading week has started slowly, with prices fluctuating either side of Monday’s opening levels around 7752. Traders may be keeping a close watch on events in the Middle East and readying themselves for the possibility of an announcement confirming the reopening of the Strait of Hormuz or disappointment as the US responds to Iranian requests for reparations, while at the same time preparing for the latest series of US inflation releases for July (CPI: Wednesday, 1330 BST 1330, PPI: Thursday, 1330 BST), that could ultimately decide whether the Fed hikes interest rates in September or waits until later in the year.
Right now, it may be too early to discuss a serious challenge of the psychological 8000 level, however by the end of the week it’s possible that the outlook may have changed dramatically.
Technical Update: Price Strength Held by Extension Resistance
The important technical development in the US 500 index last week was the successful closing break above what might have been expected to continue acting as strong resistance level at 7625 (June 2nd previous all‑time high). This activity appeared to end the recent sideways range to the upside, something traders may have anticipated could lead to further price strength.
While the initial reaction to the break of 7625 could be described as positive for the index, the chart above shows that price strength has so far been held by what could be viewed as the next key resistance at 7780 (38.2% Fibonacci extension). Traders may now be wondering whether further price strength could emerge to breach the 7780 level, or if it may continue to cap gains and ultimately lead to price weakness developing again. In this situation, being aware of the key support and resistance levels may help guide decision making.
Potential Resistance Levels:
The 38.2% extension level at 7780 has already been identified as the first potential key resistance, and this argument appears to have been strengthened further by the fact that this level capped gains again on Monday. Therefore, if risks are to turn toward further price strength, it may be closing breaks above 7780 that lead to it.
If the 7780 level is broken on a closing basis, it could open the way for further price strength toward 7874 (61.8% Fibonacci extension), possibly even 8000/8024 (psychological number and higher 100% extension).
Potential Support Levels:
While the resistance at 7780 continues to hold on a closing basis, it’s possible that price weakness may emerge again. If that’s the case, trader focus could be directed toward a first potential support at 7699 (August 6th low).
Closing breaks below the 7699 level could trigger a deeper retracement of the strength developing from the July 29th low, with scope toward 7603 (38.2% Fibonacci retracement) and possibly then 7484 (62% retracement).
The material provided here has not been prepared accordance with legal requirements designed to promote the independence of investment research and as such is considered to be a marketing communication. Whilst it is not subject to any prohibition on dealing ahead of the dissemination of investment research, we will not seek to take any advantage before providing it to our clients.
Pepperstone doesn’t represent that the material provided here is accurate, current or complete, and therefore shouldn’t be relied upon as such. The information, whether from a third party or not, isn’t to be considered as a recommendation; or an offer to buy or sell; or the solicitation of an offer to buy or sell any security, financial product or instrument; or to participate in any particular trading strategy. It does not take into account readers’ financial situation or investment objectives. We advise any readers of this content to seek their own advice. Without the approval of Pepperstone, reproduction or redistribution of this information isn’t permitted. Long 
Martin Ratio: Does Higher Return Justify the Drawdown?📊 Martin Ratio: Does Higher Return Justify the Drawdown?
📈 Return Alone Does Not Tell the Whole Story
When comparing assets, return is one of the first numbers investors examine. However, return alone can hide an important part of the investment: the drawdowns experienced along the way.
Two assets that both produce a 40% return over the same period:
RETURN vs. MAXIMUM DRAWDOWN
Asset Return Maximum DD
Asset A +40% -10%
Asset B +40% -35%
A return-only comparison indicates the two assets performed equally well, but the investment experience was clearly different.
Asset B required the investor to tolerate substantially deeper declines. Maximum drawdown tells only part of the story: it does not describe how frequently or how long the asset remained below previous peaks.
This raises a more important question:
❓ How much return was achieved relative to the drawdown experienced?
The Martin Ratio provides one way to examine that question.
📐 What Is the Martin Ratio?
The Martin Ratio is a risk-adjusted performance measure that relates return to the Ulcer Index, a drawdown-based measure of risk.
Martin Ratio = Return / Ulcer Index
The basic interpretation is straightforward:
A higher Martin Ratio means more return was achieved relative to the drawdown-related risk measured by the Ulcer Index.
The ratio therefore combines two important aspects of an investment:
• 📈 Return — what the asset earned.
• 📉 Drawdown-related risk — the depth and persistence of declines from previous peaks.
This makes the Martin Ratio particularly useful when comparing assets that may have similar returns but very different drawdown characteristics.
🩹 Why Use the Ulcer Index?
Volatility and drawdown measure different things. Volatility measures variation in returns, while drawdown measures how far an asset falls from a previous peak. The Ulcer Index is designed around drawdowns and therefore captures the depth and duration of declines rather than treating all price variation as the same type of risk. Lower Ulcer Index values indicate lower drawdown-related risk, reflecting shallower and/or less persistent declines from previous peaks.
This makes the Martin Ratio useful when the question is not simply:
“How volatile was this asset?”
but rather:
“How much return did I receive relative to the drawdown severity (magnitude and duration) I had to endure?”
⚖️ Martin Ratio vs. Sharpe and Sortino
Sharpe Ratio — Volatility
How much return relative to total variability?
Sortino Ratio — Downside volatility
How much return relative to downside variability?
Martin Ratio — Drawdown / Ulcer Index
How much return relative to drawdown-related risk?
The Martin Ratio should not be viewed as a universal replacement for Sharpe or Sortino. It answers a different question because its risk measure is explicitly drawdown-based. For example, an asset can have attractive volatility-adjusted performance while still experiencing a relatively sharp drawdown profile.
🔍 How to Interpret the Martin Ratio
Higher Martin Ratio: A higher value indicates that more return was generated relative to the Ulcer Index over the selected measurement period.
Lower Martin Ratio: A lower value indicates that the return was less efficient relative to the drawdown-related risk measured by the Ulcer Index.
Negative Martin Ratio: A negative value occurs when the measured return is negative while the Ulcer Index remains positive.
Compare Assets With Identical Settings: Martin Ratio comparisons are most meaningful when the assets use the same lookback period, return definition, calculation methodology, and timeframe.
🎯 Where Can It Be Useful?
• Comparing alternative assets or securities.
• Ranking a watchlist by risk-adjusted performance.
• Evaluating whether a higher-return asset also delivered an efficient drawdown profile.
• Comparing stocks, ETFs, sectors, commodities, markets or other tradable assets.
• Adding a drawdown-oriented perspective alongside traditional volatility-based measures such as Sharpe and Sortino.
📊 A Simple Asset-Comparison Framework
A useful way to understand the Martin Ratio is to compare several assets over the same lookback period, as demonstrated in comparison table above.
For each asset, four related statistics are examined:
• Return — what the asset earned over the measurement period.
• Maximum Drawdown — the deepest peak-to-trough decline.
• Ulcer Index — a broader measure of drawdown depth and persistence.
• Martin Ratio — return relative to the Ulcer Index.
💡 Key Takeaways from the Data
1️⃣ High Return Can Offset Higher Drawdown-Related Risk
Micron (MU) experienced the largest Maximum Drawdown (−39.10%), but also generated an exceptional 684.46% return. Its Martin Ratio of 62.03 reflects the very high return achieved relative to its drawdown-related risk.
2️⃣ Drawdown Persistence Can Affect Efficiency
Comparing CSCO and TSM, both generated nearly identical returns (~73%). However, TSM experienced a deeper Maximum Drawdown (−21.55% vs. −15.65%) and a higher Ulcer Index. Consequently, CSCO achieved a slightly higher Martin Ratio (11.28 vs. 10.87), indicating greater return relative to its drawdown-related risk.
3️⃣ Low Risk vs. High Efficiency
The S&P 500 (SPX) had the lowest Maximum Drawdown (−9.10%) and Ulcer Index (2.14%) in the comparison. However, its lower total return resulted in a Martin Ratio of 10.43, illustrating how the ratio balances return against drawdown-related risk.
⚠️ Important Considerations
• A risk-adjusted ratio should not be interpreted in isolation. Return, drawdown and the Ulcer Index should also be inspected.
• The ranking can change with the selected lookback period.
• Different assets can have very different return and drawdown characteristics, so comparisons should be made consistently.
• The Martin Ratio is a descriptive risk-adjusted performance measure, not a prediction of future returns.
🏁 Conclusion
Raw returns show what an asset earned; drawdown metrics show the risk experienced in achieving that return.
By combining return with the Ulcer Index, the Martin Ratio reveals whether an asset's gains were efficient relative to its drawdown severity—providing a perspective on performance that a return figure alone cannot offer.
 Education
Gold – Positive Reversal or Limited Recovery?In the world of financial markets, traders can become exposed to short term periods of volatility where bigger directional moves occur when they are least expected. Gold experienced one of these types of situations last week, when after being stuck in a choppy sideways range for a month between lows at 3959 from July 17th, and highs at 4166 from July 22nd, prices spiked 6.5% during a 3-day period starting early on Wednesday, eventually printing a high of 4372 on Friday, before closing at 4341.
Interestingly, the move higher seemed to be driven more by trader positioning and a technical breakout (more on this in Technical update below), than by a potential deescalation of the US-Iran conflict and some pairing back of Federal Reserve interest rate hike bets after a weaker than expected US jobs report on Friday.
Looking forward, the strength of the breakout may be put to the test at the start of this new week, with traders still waiting for officials from Iran and Oman to confirm the opening of a safe path for shipping through the Strait at Hormuz, while Iranian backed Houthi rebels continue to strike energy infrastructure in the Middle East region.
Also important for Gold traders to monitor, could be the latest US CPI release which is due on Wednesday at 1330 BST. While last month’s reading produced a more benign print, this latest update for July is expected to show consumer prices moving higher again as the Iran conflict drags on, which if true, could see markets increase their expectations for the Fed to hike interest rates in September again. Something that could weigh on Gold which doesn’t pay interest or a dividend.
If last week saw a surprise breakout for Gold, staying alert to the outcome of these events and the technical section outlined below could help traders to be more prepared for fresh upside acceleration, or a wave of profit taking which may see prices drop down to lower levels.
Technical Update: Positive Reversal or Limited Recovery?
Our recent technical focus for Gold had been on the development of a more balanced sideways range between support offered by the June 30th low at 3943 and retracement resistance at 4188, where we suggested a closing breakout of either side may be required to indicate the next directional themes. As the chart below shows, it was last week’s price strength that saw a breakout to the upside, resulting in a sharp upwards move to higher levels above 4350.
This activity could leave traders attempting to establish whether this latest upside move reflects a positive sentiment shift that could lead to further gains, or as has been the case in the past, is simply a limited phase of recovery before fresh declines reemerge. In this environment, taking time to reassess potential key support and resistance levels after such aggressive price activity may prove to be beneficial.
Potential Resistance Focus:
The successful break above resistance at the 4188 level resulted in further price strength into the end of last week, taking Gold to levels last seen on June 17th at 4382. It’s possible that this level may be the immediate resistance focus for traders to start the new week. How this level is defended on a closing basis could be a strong gauge of whether the latest upside momentum may continue.
If Gold were to close above 4382, traders may begin to focus on the possibility for a recovery toward 4514 (38.2% retracement). With, closing breaks above 4514 opening potential for a further price extension to 4595 (May 29th high), even 4688 (50% retracement).
Potential Support Focus:
While the resistance at 4382 (June 17th high) remains intact on a closing basis, traders may consider whether the latest upside is simply an unwinding of recent downside extremes and therefore limited in nature. If this is the case, fresh price weakness could be seen to test the first possible important support at 4209 (38.2% retracement).
If 4209 were breached on a closing basis, downside risks could turn toward the next potential support level at 4109 (61.8% retracement). A closing break below 4109 might then lead to further price declines, with the focus shifting toward the 3943/3959 area again (June 30th and July 17th lows).
The material provided here has not been prepared accordance with legal requirements designed to promote the independence of investment research and as such is considered to be a marketing communication. Whilst it is not subject to any prohibition on dealing ahead of the dissemination of investment research, we will not seek to take any advantage before providing it to our clients.
Pepperstone doesn’t represent that the material provided here is accurate, current or complete, and therefore shouldn’t be relied upon as such. The information, whether from a third party or not, isn’t to be considered as a recommendation; or an offer to buy or sell; or the solicitation of an offer to buy or sell any security, financial product or instrument; or to participate in any particular trading strategy. It does not take into account readers’ financial situation or investment objectives. We advise any readers of this content to seek their own advice. Without the approval of Pepperstone, reproduction or redistribution of this information isn’t permitted.
AAPL GEX - Call Wall Broken @ 310AAPL cleared a multi-week base under 310 and is now holding above that strike on the daily chart. For the 08/21 expiry (14 DTE, single), 310 is the C1 call wall — and it stacks with Ab1 and D+, so the breakout is through a real multi-metric reaction zone, not just a round number.
With C1 cleared, price has entered the positive extension zone — gamma squeeze potential opens toward the next call wall if acceptance holds above 310.
🔶 Regime Context 🔶
Spot is trading well above HVL at 300, keeping AAPL inside a positive GEX regime — price action typically becomes more controlled than below HVL. The 200 SMA remains far below (~280), so the medium-term trend backdrop stays constructive while the options structure is doing the near-term work.
🔶 Options Structure Context 🔶
👉 310 – C1 (highest call NETGEX wall) — breakout support
Confluence at 310 (08/21, 14 DTE, single):
C1 — highest call NETGEX
Ab1 — largest absolute gamma
D+ — strongest positive DEX peak
That makes 310 a clear reaction zone. Holding above it keeps the extension thesis alive; losing it puts the base break back into question.
👉 320 – C2 + CV + nCV — next magnet / target
Confluence at 320:
C2 — #2 call wall
CV — strongest call volume
nCV — strongest net call volume
Strongest call flow for 08/21 (14 DTE) is concentrated at 320 — same strike that also printed the largest call volume on the 0DTE (08/07) book. That dual signal turns 320 into the natural upside magnet inside the extension zone.
👉 330 – C3 — further extension reference if 320 accepts
🔶 Downside Structure 🔶
👉 300 – P1 / HVL / POI — regime pivot + put wall
Confluence at 300:
P1 — strongest put wall
HVL — gamma flip / regime pivot
POI — highest put open interest
Together, 300 is the main downside floor for this expiry. A clean break back through 310 would shift focus toward whether 300 can hold as the regime line.
👉 295 – P3 — next put wall below 300
Upper inventory note: for 08/21 , peak Call OI / AbOI sits further out at 340 — a distant call book magnet beyond C2/C3, not the breakout level itself.
🔶 Options Sentiment 🔶
CALL$ 23.7% means call options at an equivalent distance from spot are priced 23.7% higher than the corresponding puts — this is call pricing skew, and at this reading it remains moderate, not extreme.
On the Options Oscillator, the filled green histogram is not showing an aggressive blow-off in call skew — consistent with a controlled breakout rather than a panic chase.
IVRank 45.1
IVx 26.6 (14 DTE)
CALL$ 23.7% — call pricing skew
🔶 Key Structure to Watch 🔶
310 — C1 + Ab1 + D+ breakout support (must hold)
320 — C2 + strongest call volume (CV / nCV)
300 — P1 / HVL / POI downside floor
330 — C3 extension
For now, AAPL is holding inside a positive GEX regime above HVL, with the old 310 call wall flipped into support after the base break.
The key question is whether momentum can carry price toward the 320 call wall — and more importantly, how the market reacts once it gets there. Oil (WTI) - Race Lower Pauses at 1 Month LowThe price of Oil (WTI) remains front and centre in the headlines and this is perhaps understandable considering its impact on the direction of many other tradable markets due to its influence over the wider inflation dynamic.
Earlier in the week prices were moving aggressively lower after President Trump announced over the weekend that he was putting a hold on plans for further missile strikes on Iran to allow for the possibility of an agreement to be reached between Washington, Tehran and Oman to reopen the Strait of Hormuz, the crucial supply line for Middle East oil. This initially saw Oil drop quickly from its Friday close at 86.38, with a gap open on Monday at 79.75 which then continued down to print a 1-month low yesterday at 74.553.
However, despite Iran confirming overnight that it had reached an agreement with Oman on a proposed temporary shipping route through the Strait of Hormuz, Oil prices have remained stuck around $75 at the time of writing (75.21 0645 BST). This may be because traders are waiting for Washington, more specifically President Trump to provide his comments on the deal.
Looking forward, ahead of such an event and with the recent lows from early July at 67.551 (July 2nd) back within reach, it may be a good time to revisit the technical backdrop to determine if Oil prices could break to new lows or are moving into an important long term support zone that could attract fresh buying opportunities.
Technical Update: Using Bollinger Bands to Gauge Price Volatility:
Oil (WTI) has seen a clear increase in price volatility of late, with geo‑political news driving investor sentiment. This helped fuel a 39% rise between the July 2nd low at 67.551 and the July 23rd high at 94.108, before a sharp sell‑off developed within the last 10 trading days.
This type of activity can often be difficult for traders to navigate, but studying support and resistance levels alongside technical indicators can help judge where directional risks may lie.
One indicator that can be particularly useful in this type of environment is Bollinger Bands, which measures price volatility and helps indicate when risks may be turning toward more sustained moves in the direction of the prevailing trend.
Below, we look at historical Oil (WTI) data to show how Bollinger Bands could have helped traders identify trending conditions at the time, and what the bands may now be suggesting for Oil.
Bollinger Bands Within an Uptrend:
There are three lines to monitor within Bollinger Bands: the mid‑average, the upper band, and the lower band. The slope of the mid‑average indicates trend direction — rising suggests an uptrend, falling a downtrend, and a flat mid‑average indicates a neutral, sideways trend.
In Oil (WTI) as shown on the chart below, between the February 17th low and April 7th high, the mid‑average was rising throughout, indicating an uptrend. This suggested that traders could expect periods of price strength, with only limited corrections before fresh attempts at the upside re‑emerged.
During this time, the bands also indicated how aggressive the trend might be. In an environment of increasing price volatility, the bands widen while the mid‑average rises, suggesting price could accelerate higher and further, as long as volatility remained high and the bands continue to widen.
For Oil, when volatility steadied in late March/early April, both bands continued to rise but in parallel with the mid‑average. This was still an uptrend, as the average was moving higher, but with the bands moving parallel to each other, it suggested a less aggressive uptrend signal, but still an uptrend.
Only when the bands began to narrow and the support offered by the mid‑average was broken on a closing basis, did risks shift toward consolidation or setback in price.
Bollinger Bands Within a Downtrend:
Turning to a downtrend, such as the period in Oil (WTI) between May 18th and July 2nd we can see Bollinger Bands behaved differently (see chart below).
As soon as the mid‑average turned lower, it signalled a downtrend, and while resistance at the falling mid‑average remained intact, further price weakness was the risk. This was not an aggressive period of expanding negative volatility, as the bands didn’t widen, but they still indicated risks toward lower price levels while the mid‑average resistance remained intact and the bands fell in parallel to the average. It was closing breaks above the mid-average that eventually suggested the downtrend was over.
Bollinger Bands Within a Sideways Range – Oil (WTI) Now?
When the mid‑average of Bollinger bands is flat, it often signals more balanced, sideways themes for price. This is especially true when the upper and lower bands are also flat and moving parallel to the mid‑average. This indicates stable volatility, with price likely to move between the upper‑band resistance and lower‑band support.
This appears to be the current set‑up for Oil (WTI), suggesting that after the recent price volatility, a sideways range may now be forming. If so, support could stand at the lower band (70.409) and resistance at the upper band (92.257), with potential for this range to extend further.
An end to these balanced themes would require the mid‑average to either turn higher for a new uptrend, or lower for a new downtrend, followed by both bands turning in the direction of the emerging trend. Only then would a more sustained period of directional movement be possible, with any widening of the bands opening the possibility of a more sustained price move.
Possible Short Term Support/Resistance Levels:
While Oil prices may remain within a wide range defined by the Bollinger Bands, there are still potentially important key support levels to monitor. The first focus is at 74.553, equal to Wednesday’s session low, and if this gives way, attention could shift to 71.063, the July 10th session extreme. A closing break below 71.063 might then expose the 70.409 lower Bollinger band and range‑lower extremes.
To the upside, focus could now be on 81.833, the Bollinger mid‑average, as the first key resistance. Closing breaks above 81.821 could potentially lead to further price strength. If such moves develop, it could open tests of 86.510, the July 31st high, and if this level is broken on a closing basis, on toward 92.257, the upper Bollinger band and upper extremes of the sideways range.
The material provided here has not been prepared accordance with legal requirements designed to promote the independence of investment research and as such is considered to be a marketing communication. Whilst it is not subject to any prohibition on dealing ahead of the dissemination of investment research, we will not seek to take any advantage before providing it to our clients.
Pepperstone doesn’t represent that the material provided here is accurate, current or complete, and therefore shouldn’t be relied upon as such. The information, whether from a third party or not, isn’t to be considered as a recommendation; or an offer to buy or sell; or the solicitation of an offer to buy or sell any security, financial product or instrument; or to participate in any particular trading strategy. It does not take into account readers’ financial situation or investment objectives. We advise any readers of this content to seek their own advice. Without the approval of Pepperstone, reproduction or redistribution of this information isn’t permitted.