OPEN-SOURCE SCRIPT
TripleQMatrix: HTF Projection Nico
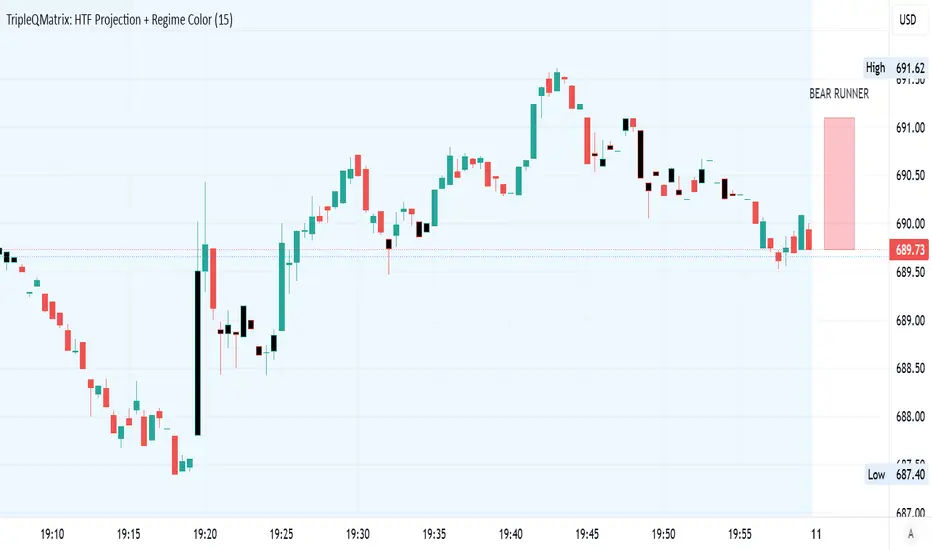
The Higher Timeframe (HTF) Projection is a professional trading tool designed to solve the "tunnel vision" that often occurs when scalping on lower timeframes like the 30-second or 15-minute charts.
What is it?
It takes a higher timeframe candle (like a 15-minute bar) and projects its data—Open, High, Low, and Close—directly onto your lower-timeframe chart. It essentially gives you a "ghost" of the larger market context while you are focused on micro-scalping.
How to use it effectively
Using this tool correctly is all about **Contextual Alignment**:
1. Regime Filtering: Use the projected candle's color (or the "Chop/Runner" status) to determine your market bias.
If the HTF box is Gray (Chop): Avoid directional scalping. The market is in equilibrium, and institutional participation is too low for a sustained run.
If the HTF box is Green/Red (Runner): This confirms the current 15-minute trend. Look to only take scalp trades that align with this direction (e.g., if the box is Red/Bearish, prioritize short-selling opportunities).
2. Projection as a "Magnet": Large institutions often trade based on the levels of these HTF candles. Use the projected **High** and **Low** lines as potential "magnets." If price is trending toward the HTF High, anticipate institutional selling (rejection) at that level.
3. The "Close" Countdown: The timer label tells you exactly when the 15-minute candle will finalize. Scalpers often experience increased volatility in the final 60 seconds of a 15-minute bar as institutions "mark the close." Use this countdown to protect your open positions.
The Institutional Workflow
Entry: Wait for a short-term reversal signal (like your **Institutional Rejection** indicator) that happens within the range of the projected HTF candle.
Exit: Set your profit targets based on the HTF High/Low levels, as these are the zones where the "Big Money" is likely to take profits or re-enter.
By keeping the HTF projection on your chart, you are no longer just scalping "price action"; you are scalping in harmony with the timeframe that institutional algorithms use to structure their daily entries.
What is it?
It takes a higher timeframe candle (like a 15-minute bar) and projects its data—Open, High, Low, and Close—directly onto your lower-timeframe chart. It essentially gives you a "ghost" of the larger market context while you are focused on micro-scalping.
How to use it effectively
Using this tool correctly is all about **Contextual Alignment**:
1. Regime Filtering: Use the projected candle's color (or the "Chop/Runner" status) to determine your market bias.
If the HTF box is Gray (Chop): Avoid directional scalping. The market is in equilibrium, and institutional participation is too low for a sustained run.
If the HTF box is Green/Red (Runner): This confirms the current 15-minute trend. Look to only take scalp trades that align with this direction (e.g., if the box is Red/Bearish, prioritize short-selling opportunities).
2. Projection as a "Magnet": Large institutions often trade based on the levels of these HTF candles. Use the projected **High** and **Low** lines as potential "magnets." If price is trending toward the HTF High, anticipate institutional selling (rejection) at that level.
3. The "Close" Countdown: The timer label tells you exactly when the 15-minute candle will finalize. Scalpers often experience increased volatility in the final 60 seconds of a 15-minute bar as institutions "mark the close." Use this countdown to protect your open positions.
The Institutional Workflow
Entry: Wait for a short-term reversal signal (like your **Institutional Rejection** indicator) that happens within the range of the projected HTF candle.
Exit: Set your profit targets based on the HTF High/Low levels, as these are the zones where the "Big Money" is likely to take profits or re-enter.
By keeping the HTF projection on your chart, you are no longer just scalping "price action"; you are scalping in harmony with the timeframe that institutional algorithms use to structure their daily entries.
Open-source Skript
Ganz im Sinne von TradingView hat dieser Autor sein/ihr Script als Open-Source veröffentlicht. Auf diese Weise können nun auch andere Trader das Script rezensieren und die Funktionalität überprüfen. Vielen Dank an den Autor! Sie können das Script kostenlos verwenden, aber eine Wiederveröffentlichung des Codes unterliegt unseren Hausregeln.

Haftungsausschluss
Die Informationen und Veröffentlichungen sind nicht als Finanz-, Anlage-, Handels- oder andere Arten von Ratschlägen oder Empfehlungen gedacht, die von TradingView bereitgestellt oder gebilligt werden, und stellen diese nicht dar. Lesen Sie mehr in den Nutzungsbedingungen.
Open-source Skript
Ganz im Sinne von TradingView hat dieser Autor sein/ihr Script als Open-Source veröffentlicht. Auf diese Weise können nun auch andere Trader das Script rezensieren und die Funktionalität überprüfen. Vielen Dank an den Autor! Sie können das Script kostenlos verwenden, aber eine Wiederveröffentlichung des Codes unterliegt unseren Hausregeln.
Haftungsausschluss
Die Informationen und Veröffentlichungen sind nicht als Finanz-, Anlage-, Handels- oder andere Arten von Ratschlägen oder Empfehlungen gedacht, die von TradingView bereitgestellt oder gebilligt werden, und stellen diese nicht dar. Lesen Sie mehr in den Nutzungsbedingungen.