OPEN-SOURCE SCRIPT
Aktualisiert SWIFTEDGE DAX
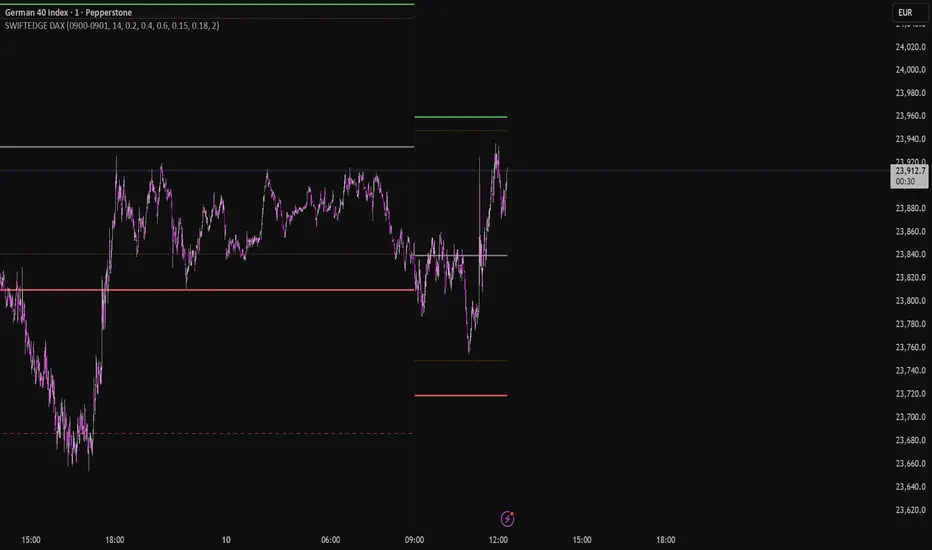
DAX Intraday ATR Bias Levels
Overview
This indicator is designed for intraday traders focusing on the DAX (GER40). It visualizes the relationship between market noise and directional trends by anchoring to the Frankfurt Open (09:00 CET) and projecting dynamic levels based on the asset's current volatility (Average True Range).
The Logic Behind the 09:00 Anchor
The 09:00 CET timestamp marks the official opening of the Xetra exchange, bringing the highest surge in volume and liquidity to the DAX. By fixing the "anchor point" at this specific moment, the indicator establishes an objective baseline for the day’s price action, filtering out the lower-volume noise from the overnight sessions.
Key Features & Methodology
The system utilizes a 14-day Average True Range (ATR) to calculate and plot levels that adapt to changing market environments:
Standard Targets (TP1 - 0.2x ATR): Represents the most frequent daily expansion levels.
Trend Targets (TP2 & TP3 - 0.4x & 0.6x ATR): Visualizes extended levels typically reached during high-conviction trend days or periods of increased volatility.
Median MAE (Maximum Adverse Excursion): The orange dotted lines represent statistical "normal" retracement zones. These lines help traders distinguish between a standard pullback and a potential trend failure. By visualizing the median MAE, traders can remain patient during minor fluctuations.
Visual Guide
Gray Line: Frankfurt Open Price (09:00).
Green Lines (Upward): Projected targets for Long-bias scenarios.
Red Lines (Downward): Projected targets for Short-bias scenarios.
Orange Dotted Lines: Statistical retracement thresholds (0.15 for long / 0.18 for short bias).
How to Use
This tool is intended as a visual decision-support system. It helps traders identify:
When a breakout from the open is statistically "overstretched."
Where to expect potential pullbacks (MAE) before a target is reached.
Objective profit-taking zones based on actual market volatility rather than fixed point values.
Disclaimer: This tool is for educational and analytical purposes only and does not constitute financial advice.
Overview
This indicator is designed for intraday traders focusing on the DAX (GER40). It visualizes the relationship between market noise and directional trends by anchoring to the Frankfurt Open (09:00 CET) and projecting dynamic levels based on the asset's current volatility (Average True Range).
The Logic Behind the 09:00 Anchor
The 09:00 CET timestamp marks the official opening of the Xetra exchange, bringing the highest surge in volume and liquidity to the DAX. By fixing the "anchor point" at this specific moment, the indicator establishes an objective baseline for the day’s price action, filtering out the lower-volume noise from the overnight sessions.
Key Features & Methodology
The system utilizes a 14-day Average True Range (ATR) to calculate and plot levels that adapt to changing market environments:
Standard Targets (TP1 - 0.2x ATR): Represents the most frequent daily expansion levels.
Trend Targets (TP2 & TP3 - 0.4x & 0.6x ATR): Visualizes extended levels typically reached during high-conviction trend days or periods of increased volatility.
Median MAE (Maximum Adverse Excursion): The orange dotted lines represent statistical "normal" retracement zones. These lines help traders distinguish between a standard pullback and a potential trend failure. By visualizing the median MAE, traders can remain patient during minor fluctuations.
Visual Guide
Gray Line: Frankfurt Open Price (09:00).
Green Lines (Upward): Projected targets for Long-bias scenarios.
Red Lines (Downward): Projected targets for Short-bias scenarios.
Orange Dotted Lines: Statistical retracement thresholds (0.15 for long / 0.18 for short bias).
How to Use
This tool is intended as a visual decision-support system. It helps traders identify:
When a breakout from the open is statistically "overstretched."
Where to expect potential pullbacks (MAE) before a target is reached.
Objective profit-taking zones based on actual market volatility rather than fixed point values.
Disclaimer: This tool is for educational and analytical purposes only and does not constitute financial advice.
Versionshinweise
Updatet little dashboard Versionshinweise
Dayli range in dashboardVersionshinweise
Visuals updatetVersionshinweise
Dashboard updated with live statisticsVersionshinweise
name updatetVersionshinweise
Updatet dashboardVersionshinweise
dashboard updateOpen-source Skript
Ganz im Sinne von TradingView hat dieser Autor sein/ihr Script als Open-Source veröffentlicht. Auf diese Weise können nun auch andere Trader das Script rezensieren und die Funktionalität überprüfen. Vielen Dank an den Autor! Sie können das Script kostenlos verwenden, aber eine Wiederveröffentlichung des Codes unterliegt unseren Hausregeln.

Order-flow and session tooling for BTC — swiftedge.uk/depth
Haftungsausschluss
Die Informationen und Veröffentlichungen sind nicht als Finanz-, Anlage-, Handels- oder andere Arten von Ratschlägen oder Empfehlungen gedacht, die von TradingView bereitgestellt oder gebilligt werden, und stellen diese nicht dar. Lesen Sie mehr in den Nutzungsbedingungen.
Open-source Skript
Ganz im Sinne von TradingView hat dieser Autor sein/ihr Script als Open-Source veröffentlicht. Auf diese Weise können nun auch andere Trader das Script rezensieren und die Funktionalität überprüfen. Vielen Dank an den Autor! Sie können das Script kostenlos verwenden, aber eine Wiederveröffentlichung des Codes unterliegt unseren Hausregeln.
Order-flow and session tooling for BTC — swiftedge.uk/depth
Haftungsausschluss
Die Informationen und Veröffentlichungen sind nicht als Finanz-, Anlage-, Handels- oder andere Arten von Ratschlägen oder Empfehlungen gedacht, die von TradingView bereitgestellt oder gebilligt werden, und stellen diese nicht dar. Lesen Sie mehr in den Nutzungsbedingungen.